Goal
To establish a microflow-nanospray ESI-MS (MnESI-MS) platform for mass spectrometry analysis of intact monoclonal antibody (mAb), that achieves high sensitivity, high quantitation accuracy, and high robustness, using Newomics® MnESI sources, M3 multinozzle emitters, and flow splitting kits (as needed for high-flow HPLC/UPLC systems).
Introduction
LC-MS analysis of intact proteins (top-down approach) can provide whole molecular quantification and high-level sequence and structure information, including catabolism or other modifications to proteins. Recent advances in sample preparation techniques and high-resolution MS instruments have led to the increased application of quantitative bioanalysis of large protein therapeutics using a top-down approach [1-6]. Currently, high-flow LC-MS has been widely used for the analysis of intact proteins. Due to the low ionization efficiency at high (analytical) flow rates, the sensitivity is poor with a typical limit of quantitation (LOQ) in the range of ~100 ng/ml. The Newomics award-winning silicon multinozzle emitters (M3 emitters) split the incoming microflow eluent into multiple nanoflows at each nozzle, thereby significantly enhancing the ionization efficiency and reducing the matrix effects for ESI-MS ([7-10] and Newomics Application Notes [11-15]). In this Application Note, we demonstrate a new microflow-nanospray ESI-MS platform for LC-MS quantification of intact mAb. We obtained over 10-fold improvement in sensitivity and achieved a LOQ of 10 ng/mL with NIST mAb. Furthermore, we achieved a CV of less than 5% which outperformed the high-flow LC-MS method with the same amount of injection material. Our MnESI-MS platform is amenable for a microflow LC system, as well as a high-flow LC system when interfaced with a Newomics® flow splitting kit. The new LC-MnESI-MS method will facilitate rapid characterization and quantitation of therapeutic antibodies.
Methods
1. Sample Preparation
The IgG monoclonal antibody was purchased from NIST (SRM 8671). Bovine Serum Albumin (BSA, Cat. # A3059-10G) and HPLC-grade water and acetonitrile (ACN) were purchased from Sigma-Aldrich (St. Louis, MO). Formic acid (FA) was purchased from Fisher Scientific (Cat. # A117-50). Aliquoted antibody stored at -80°C freezer was thawed at room temperature and serially diluted into solutions of 0.1% FA or 50 ng/µl BSA in 0.1% FA before LC-MS analysis.
2. MnESI-MS platform for LC-MS analysis
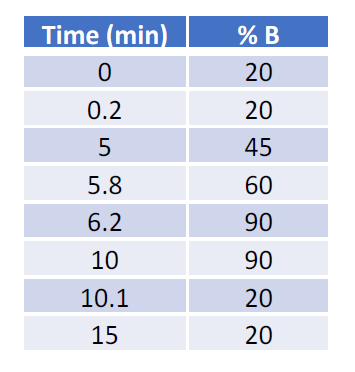
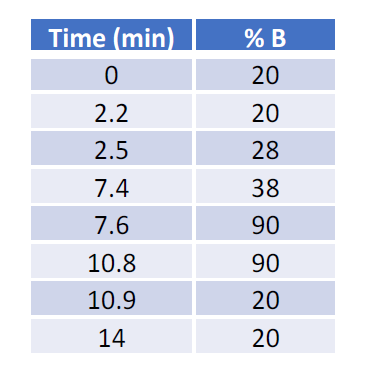
For sensitivity comparison, 100 ng neat IgG mAb was injected using a 1 µl full loop injection method. For IgG dilution analysis, 5 µl IgG of various concentrations in 50 ng/µl BSA solution was injected using a user-defined program. The microflow LC was performed with a 0.3 mm ID BEH C4 column (50 x 0.3 mm, Waters Cat. #186009260 for neat IgG analysis; 100 x 0.3 mm, Waters Cat. #186009261 for IgG dilution analysis using BSA as carrier protein). The high-flow LC was performed with a 2.1 mm ID BEH C4 column (50 x 2.1 mm, Waters Cat. # 186004495). All columns have the same chemistry with 300 Å pore size and 1.7 µm bead size. The column temperature was set at 70 °C. The LC gradients were listed in Table 1 and Table 2. Mobile phase A was 3% ACN with 2% FA; Mobile phase B was 97% ACN with 0.2% FA.
Mass spectra were acquired on a Thermo Fisher Orbitrap Q Exactive Plus mass spectrometer interfaced with an UltiMate 3000 RSLC nano UPLC system (Thermo Fisher Scientific). MnESI ion source was either directly connected to the microflow LC column or to a high-flow column through a Newomics® flow splitter (Figure 1).
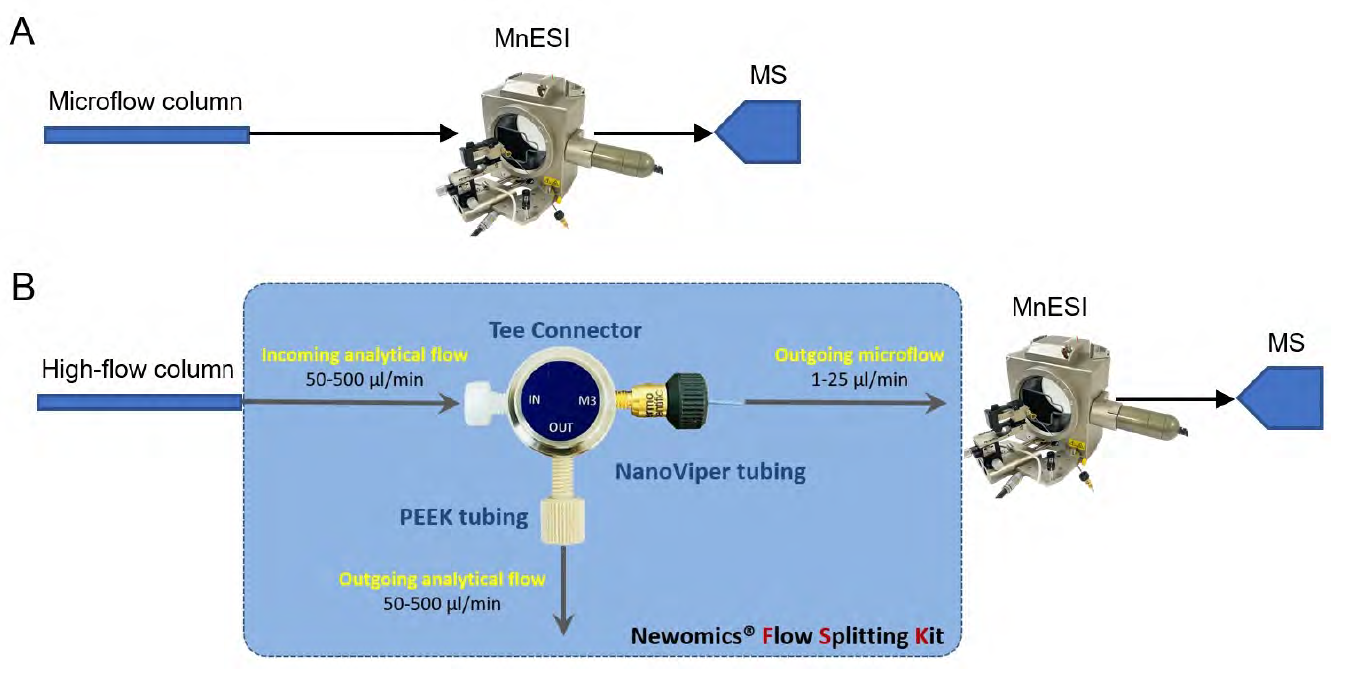
to the MnESI-MS directly. B. High-flow LC-MS setup. A high-flow LC column was connected to MnESI-MS through
a flow splitter. The majority (~90%) of the incoming flow was diverted to a UV detector or directly to waste.
We performed a comparison of the LC-MS analysis among three platforms. The LC and MS source conditions were listed in Table 3. The following emitters were used in our studies: a Thermo Fisher high-flow needle inserts assembly (HESI high-flow, single nozzle, 100 µm ID, catalog # Opton 53010), a Thermo Fisher low-flow needle insert assembly (HESI low-flow, single nozzle, 75 µm ID, catalog # Opton 53011), a Newomics® M3 emitter (8 nozzles, 10 µm ID, catalog # E8N10MU01), and a Newomics® M3 emitter (8 nozzles, 20 µm ID, catalog # E8N20MU01 for post-column splitting analysis).
For M3 emitters, the electrospray voltage was optimized at ~3 kV with 2.4 mm from the ion transfer tube. The optimal source condition for MnESI at 20 µl/min for post-column splitting analysis was the same as those for MnESI at 5 µl/min. 1 unit of desolvation gas was used for M3 emitters.
For the HESI needle, the electrospray voltage was optimized at 3.8 kV at position A for 5 µl/min flow rate, and 3.5 kV at position C for 250 µl/min flow rate. The ion transfer tube temperature was set at 275 °C for microflow and 300 °C for high flow.
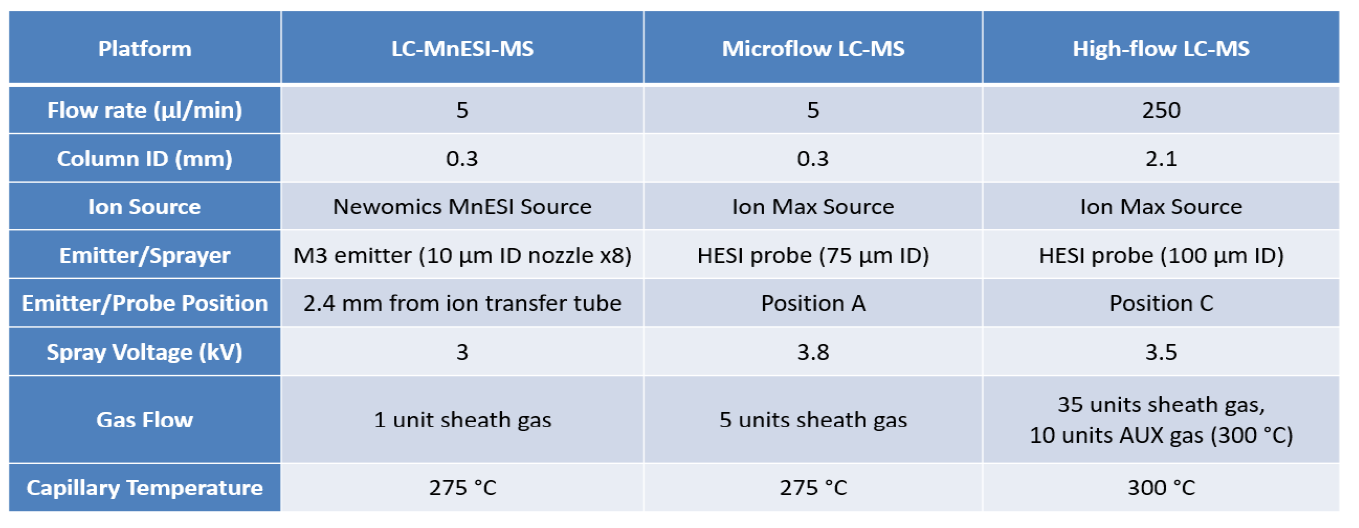
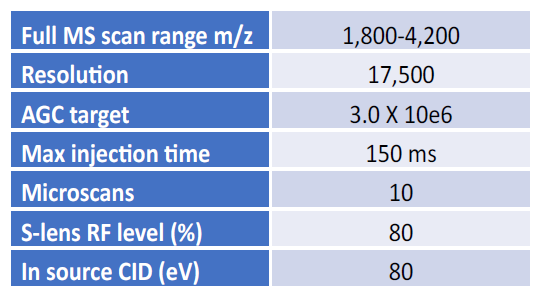
The shared MS conditions for the three platforms were listed in Table 4. For IgG serial dilution analysis using BSA as the carrier protein, a full MS scan from m/z 2,500 to 3,200 was acquired.
3. Data Analysis
Data were analyzed using Xcalibur software and Biopharma Finder 2.0 software (Thermo Fisher Scientific). The quantification of the most abundant IgG proteoforms (G0FG1F) for the dilution curve was processed by Biopharma Finder 2.0 using the sliding window deconvolution algorithm with the ReSpect The window size was set at 0.1 min with 30% offset.
Results and Discussion
1. MnESI-MS platform significantly improves sensitivity for intact monoclonal antibody analysis
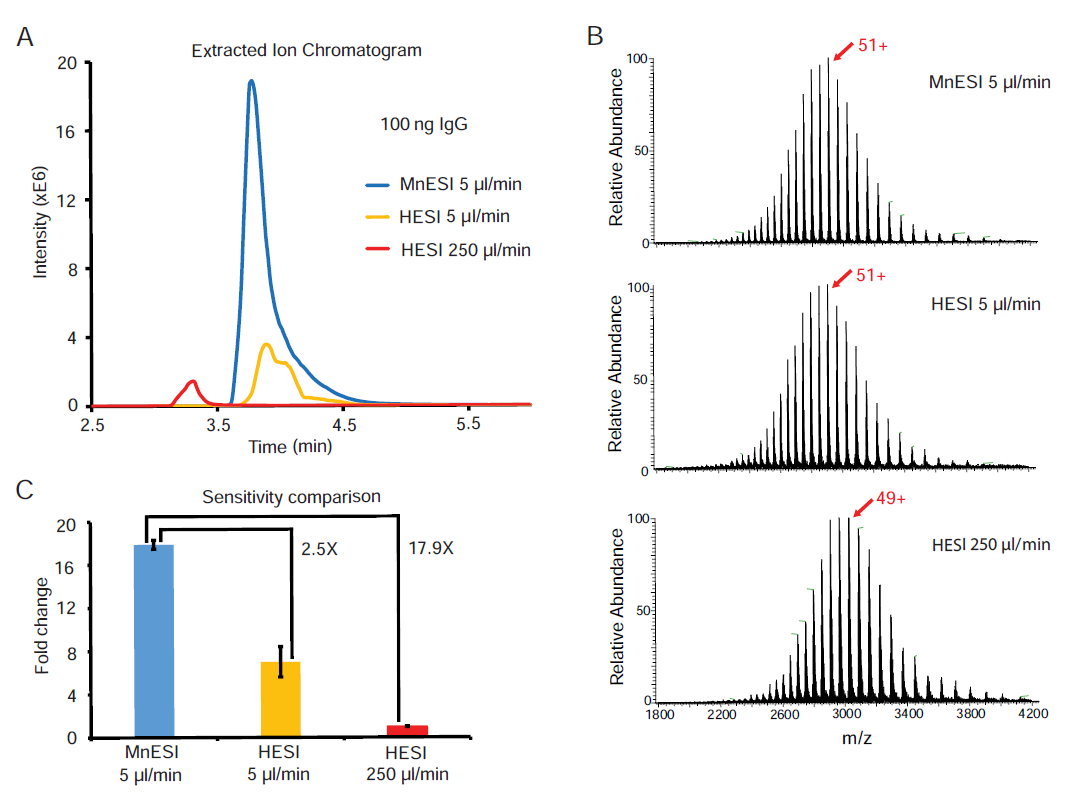
We performed a three-way comparison to assess the sensitivity performance of the MnESI-MS platform. We examined the sensitivity gain of MnESI over the conventional HESI platform using 100 ng on-column neat IgG mAb under the optimized conditions for each analysis. First, we experimented with a wide range of flow rates (1 – 25 µl/min) for MnESI and found 5 µl/min had the best balance of sensitivity and robustness for antibody analysis. For example, 5 µl/min was about 1.2- and 1.5-fold more sensitive than 10 and 15 µl/min flow rate, respectively. Although reduction of the flow rate to 2 µl/min further increased the sensitivity, it sacrificed robustness and throughput. Therefore, we chose 5 µl/min as our default flow rate for MnESI and compared it to HESI at the same flow rate or HESI at 250 µl/min with an analytical column.
Figure 2A shows the representative extracted ion chromatogram of the most abundant ion from each platform. We observed a slight charge envelope shift with the highest charge state of 51+ for microflow (MnESI and microflow HESI) compared to 49+ for high-flow HESI (Figure 2B), suggesting better ionization of the denatured IgG for micro-flow LC-MS. We demonstrated an average of 17.9-fold sensitivity gain of MnESI over high-flow HESI, and an average of 2.5-fold sensitivity gain of MnESI over microflow HESI using the peak area of the most abundant ion for quantification (Figure 2C).
2. MnESI-MS platform achieves a lower limit of quantitation and excellent robustness for intact monoclonal antibody analysis
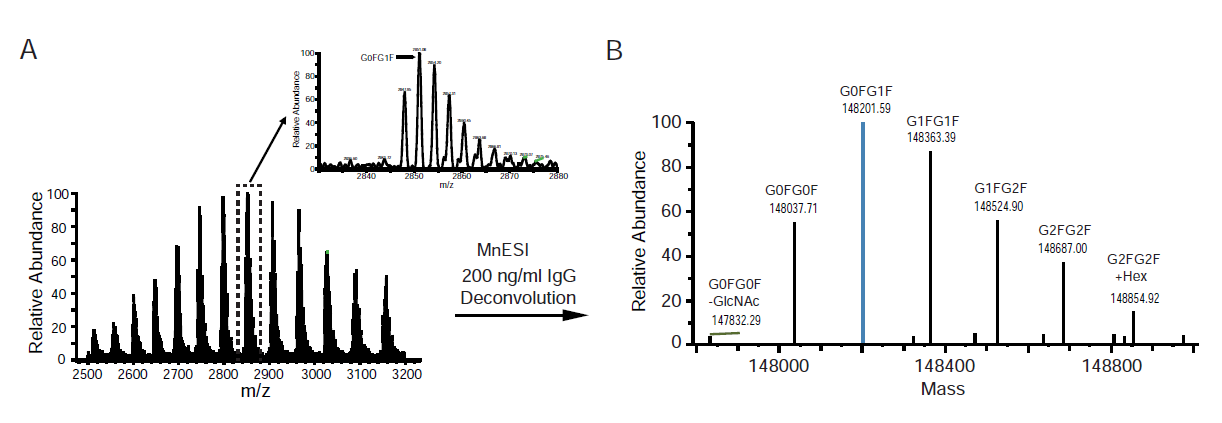
We then examined whether the sensitivity gain of MnESI over the conventional HESI platform can be translated into the improvement in the limit of detection and quantification. We performed serial dilutions of IgG using BSA as the carrier protein. We optimized the LC gradient to separate the IgG peak from that of BSA and used a narrow MS scan range to improve IgG detection. In addition, we chose the charge deconvolution method for quantification over the extracted ion chromatogram method because it mitigated the effect of IgG peak overlapping with that of BSA at their low concentration (Figure 3). Using this method, we were able to detect intact IgG down to 4 ng/ml by MnESI-MS. In addition to all five major glycoforms, some low abundant proteoforms of IgG were identified at 200 ng/ml (Figure 3B) [16].
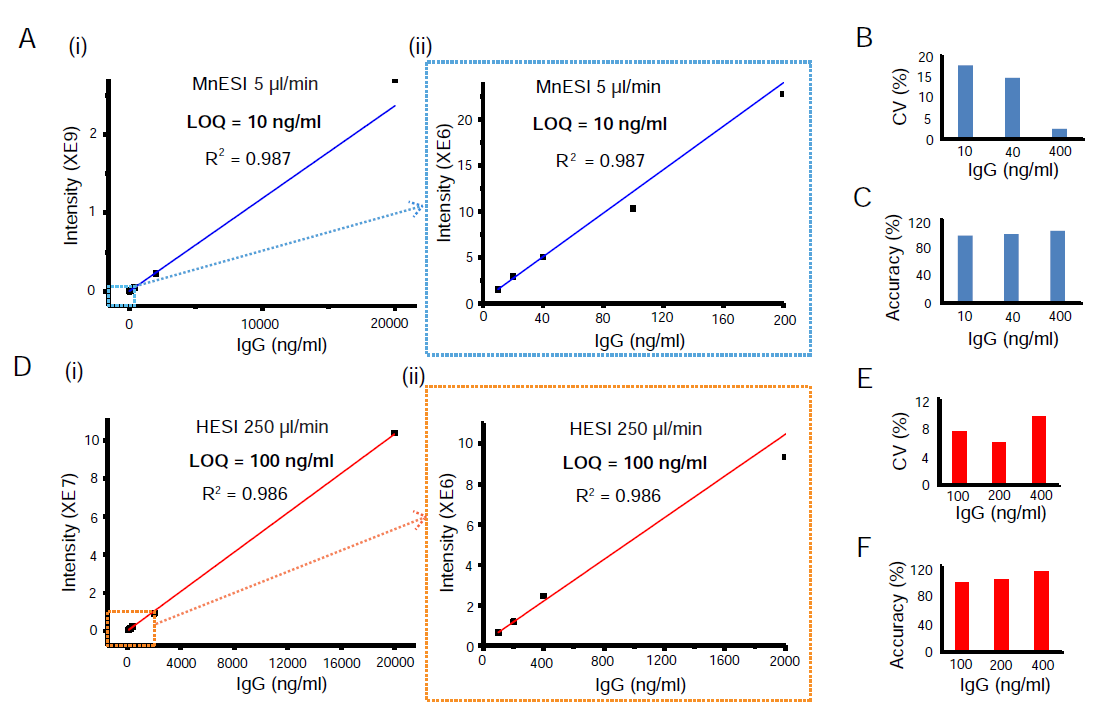
We used the most abundant glycoform of IgG (G0FG1F) for quantification with the linear regression and 1/x2 weighting. A linear dynamic range of more than 3 orders of magnitude was achieved for MnESI at 5 µl/min flow rate, with a limit of quantification (LOQ) at 10 ng/ml (Figure 4A). CV values for the dilution curve were within 20% at low concentrations (< 100 ng/ml), with the overall lower CV at higher IgG concentration (Figure 4B). The quantitation accuracies were determined to be above 90% (Figure 4C).
In contrast, we achieved more than 2 orders of magnitude of the linear dynamic range for high-flow HESI, with a LOQ at 100 ng/ml (Figure 4D). The CVs from high-flow HESI were mostly within 10%, with an overall lower CV at higher IgG concentrations (Figure 4E). The quantitation accuracies were mostly above 90% (Figure 4F). Compared to HESI at 250 µl/min, MnESI at 5 µl/min exhibited a 10-fold lower LOQ (Figure 4A and 4D), which is consistent with the 10-fold sensitivity gain from the neat IgG analysis (Figure 2).
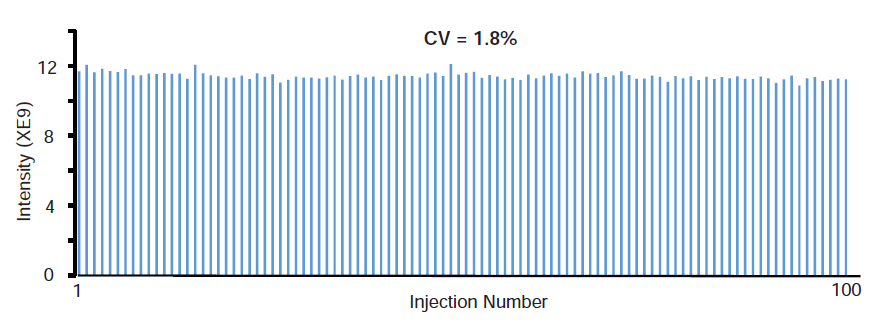
We also performed the robustness assessment of MnESI-MS for intact mAb analysis. A CV of 1.8% was achieved from the 100 consecutive LC-MS runs, without any significant decrease in signal intensity when using EIC peak area for quantification at 10 µl/min flow rate (Figure 5). Additionally, we did not observe any significant degradation of this emitter after 100 runs. The lifetime of the emitter will be explored in future studies.
3. MnESI-MS platform seamlessly integrates with the high-flow LC system for intact monoclonal antibody analysis
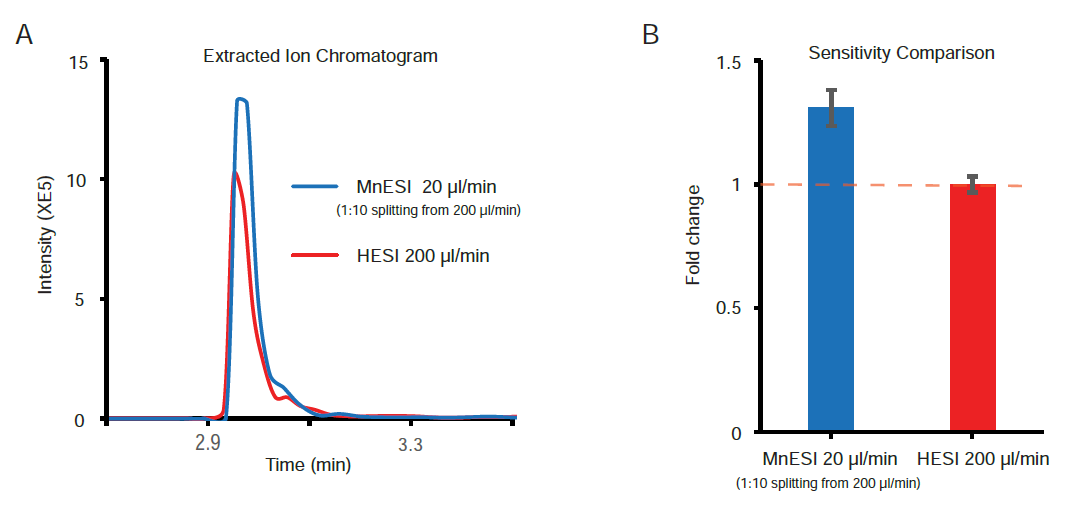
Since the traditional workflow for intact MS analysis of IgG is high-flow LC-MS by HESI, we evaluated the performance of coupling MnESI with a high-flow LC system and 2.1mm ID column using a Newomics® post-column splitting kit (Figure 1). A T-splitter was used to split the analytical flow of 200 µl/min from the LC column down to a microflow of 20 µl/min that is delivered to a 20 µm-ID, 8-nozzle M3 emitter for spray into MS. A representative extracted ion chromatogram of the most abundant ion from both platforms is shown in Figure 6A. Compared to the conventional high-flow method without splitting, this new method by flow splitting to M3 emitters achieved slightly better sensitivity (~1.3 fold), with only 10% of IgG delivered to MS (Figure 6B). Our MnESI-MS workflow with post-column splitting allows simultaneous detection of mAb by UV and MS without the need to change the LC system. In addition, the majority of the IgG injected onto the high-flow column was diverted to a UV detector or waste rather than going into the mass spectrometer, minimizing the contamination of the ion cone and C-trap of the QE instrument. This will significantly improve the assay robustness for intact antibody quantitation.
Conclusions
We have established a new MnESI-MS platform for sensitive and robust LC-MS analysis of intact monoclonal antibodies. By interfacing to an Orbitrap Q Exactive Plus mass spectrometer, Newomics® MnESI platforms have achieved high sensitivity and high robustness for quantification of intact mAb. We demonstrate the following significant advantages of our LC-MnESI-MS platform using M3 emitters over the traditional high-flow LC-HESI-MS platform:
- More than 10-fold sensitivity gain and ~10-fold lower LOQ (10 ng/mL).
- Robust performance for microflow LC-MS with a CV of < 2% over 100
- Compatibility with high-flow LC systems with the post-column flow splitting, showing increases in sensitivity and robustness (due to reduced MS contamination).
References
- Donnelly, P. et al. (2019) Best practices and benchmarks for intact protein analysis for top-down mass spectrometry. Nat Methods 16 (7), 587-594.
- Kang, L. et al. (2017) Simultaneous Catabolite Identification and Quantitation of Large Therapeutic Protein at the Intact Level by Immunoaffinity Capture Liquid Chromatography-High-Resolution Mass Anal Chem 89 (11), 6065-6075.
- Kang, L. et (2020) LC-MS bioanalysis of intact proteins and peptides. Biomed Chromatogr 34 (1), e4633.
- Kellie, F. et al. (2020) Intact Protein Mass Spectrometry for Therapeutic Protein Quantitation, Pharmacokinetics, and Biotransformation in Preclinical and Clinical Studies: An Industry Perspective. J Am Soc Mass Spectrom.
- Qiu, et al. (2018) Quantitation of intact monoclonal antibody in biological samples: comparison of different data processing strategies. Bioanalysis 10 (13), 1055-1067.
- Williams, P. et al. (2020) Top-Down Characterization of Denatured Proteins and Native Protein Complexes Using Electron Capture Dissociation Implemented within a Modified Ion Mobility-Mass Spectrometer. Anal Chem 92 (5), 3674-3681.
- Kim, et al. (2007) Microfabricated monolithic multinozzle emitters for nanoelectrospray mass spectrometry. Anal Chem 79 (10), 3703-7.
- Mao, P. et al. (2013) Multinozzle emitter array chips for small-volume proteomics. Anal Chem 85 (2), 816-9.
- Mao, P. et al. (2011) Multinozzle emitter arrays for nanoelectrospray mass spectrometry. Anal Chem 83 (15), 6082-9.
- Chen, et al. (2018) Quantitation of Intact Proteins in Human Plasma Using Top-Down Parallel Reaction Monitoring-MS. Anal Chem 90 (18), 10650-10653.
- ACS Book series: “State-of-the-Art and Emerging Technologies for Therapeutic Monoclonal Antibody Characterization”; Volume 2, Biopharmaceutical Characterization: the NIST mAb Case Study; Chapter 1, Determination of the NISTmAb Primary Structure.