Goal
To develop a Microflow LC-Nanospray ESI-MS (MnESI-LC-MS) platform for bottom-up proteomics that achieves high-throughput, high-sensitivity, and robustness, by using Newomics® M3 Emitters and Thermo Fisher PepMap™ C18 columns on a Q Exactive™ Plus mass spectrometer
Introduction
Liquid chromatography-mass spectrometry (LC-MS) is the enabling technology for global-scale analysis of proteins (proteomics). Nanoflow LC-MS (flow rate < 1 µL/min) is routinely used to achieve high sensitivity for identifying and quantifying thousands of peptides and proteins in small volumes of biological samples, but lacks robustness and throughput (i.e., speed). By contrast, microflow LC-MS ( ow rate 1-50 µL/min) typically achieves higher throughput and robustness with relative standard deviation (RSD) < 20%, but lacks the sensitivity of nanoflow LC-MS. The Newomics award-winning silicon multinozzle emitters (M3 emitters) enable optimization of sensitivity, throughput, and robustness by splitting the microflow eluent evenly into multiple nanoflows at the emitter, thereby dramatically enhancing the ionization efficiency. In this Application Note, we demonstrate the application of our microflow LC-nanospray ESI-MS platform (MnESI-LC-MS) for bottom-up proteomics studies of HeLa whole cell lysates and human plasma samples.
Methods
Sample Preparation
Pierce™ HeLa Protein Digest Standard (Thermo Fisher, USA, Cat.#: 88329) and human plasma digest, prepared by EasyPep™ Mini MS Sample Prep Kit (Thermo Fisher, USA, Cat.#: A40006), were used for bottom-up LC-MS analysis. During the experiments, standards for robustness and sensitivity tests were resuspended in Solvent A (3% acetoni- trile in 97% water with 0.1% formic acid). HeLa protein digests were diluted into 25, 50, 100, 200, 500, 1000, and 2500 ng/mL with Solvent A. Standards were prepared in glass vials to reduce adsorption to plastic surfaces. All standards were kept at -20°C until analysis.
Instrumentation
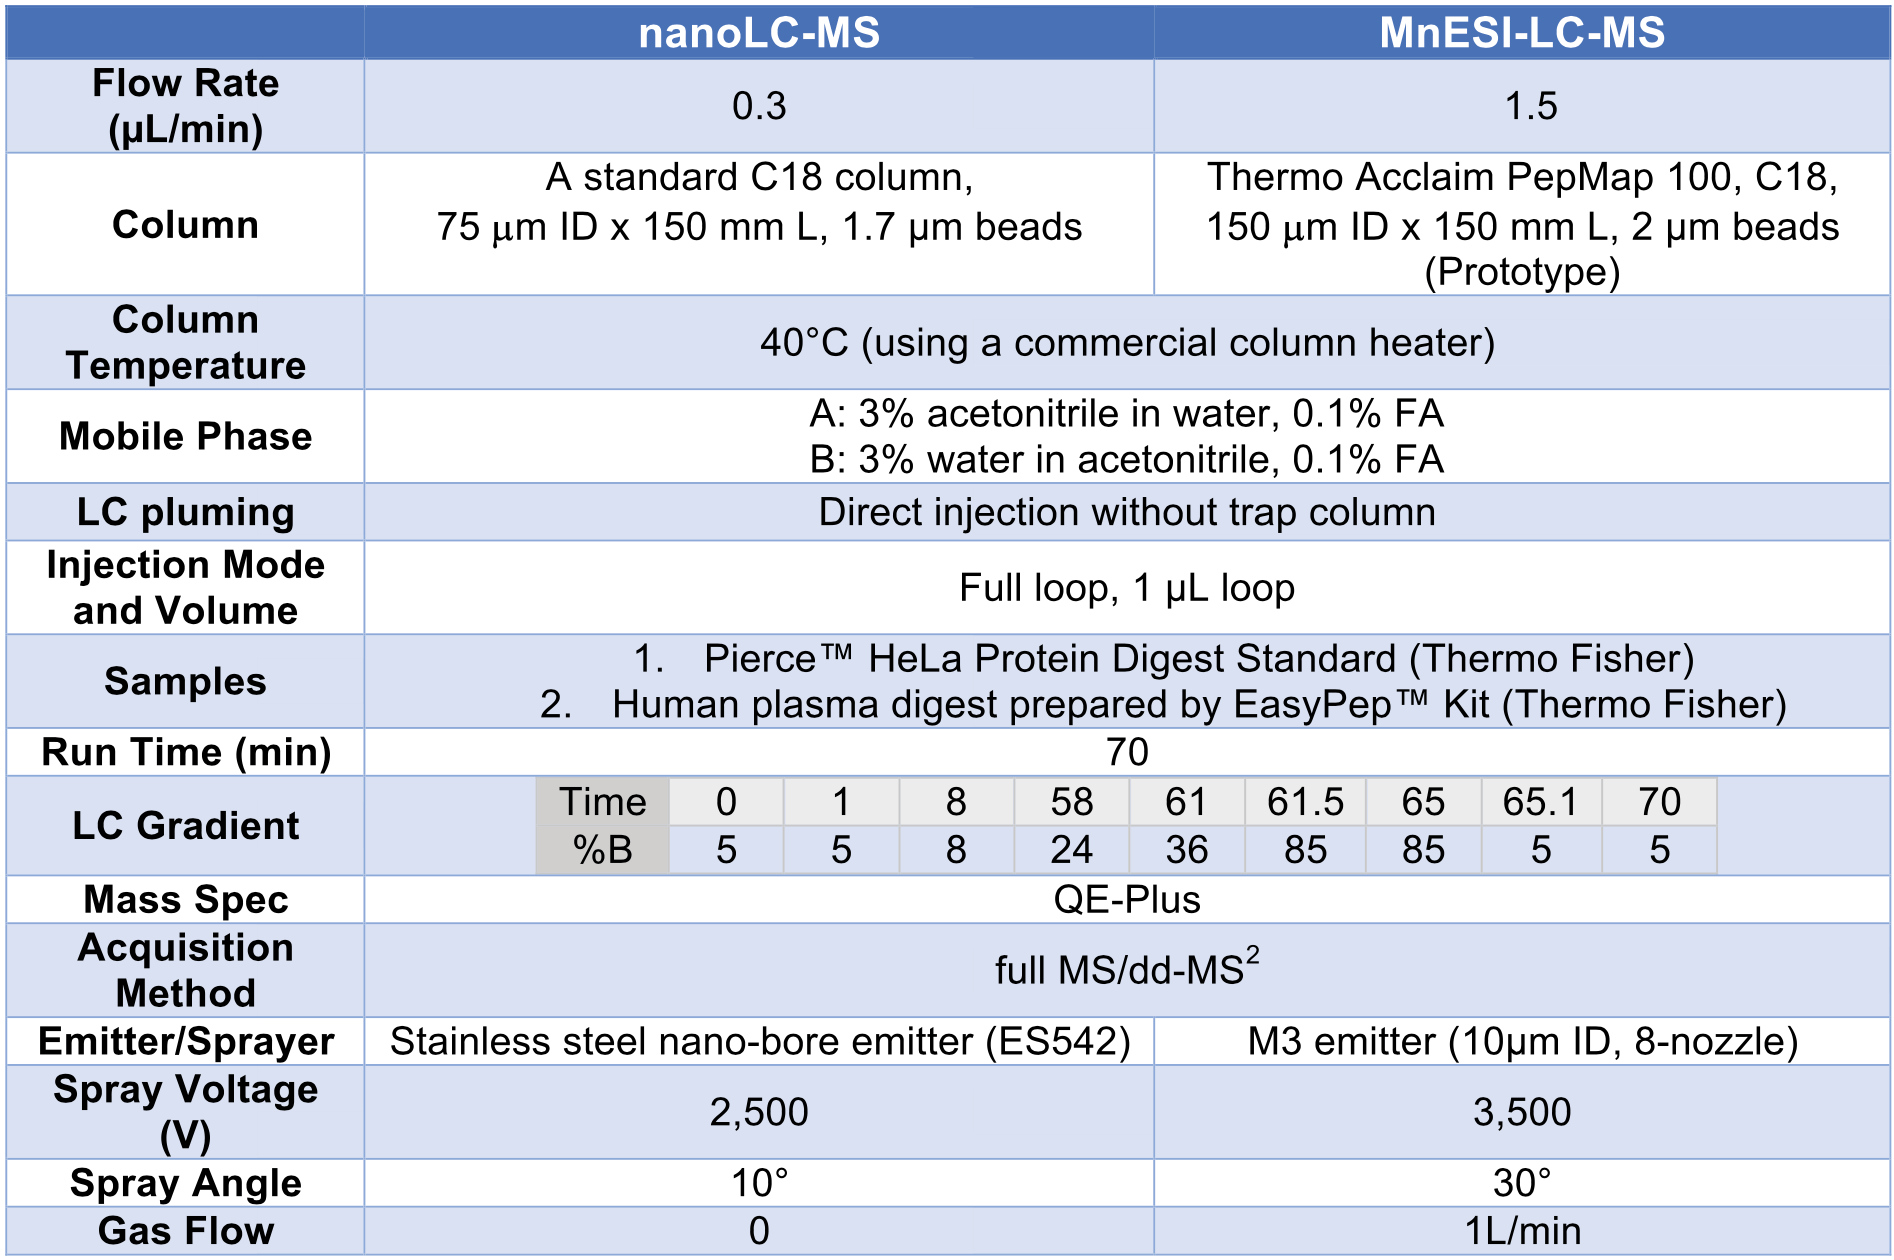
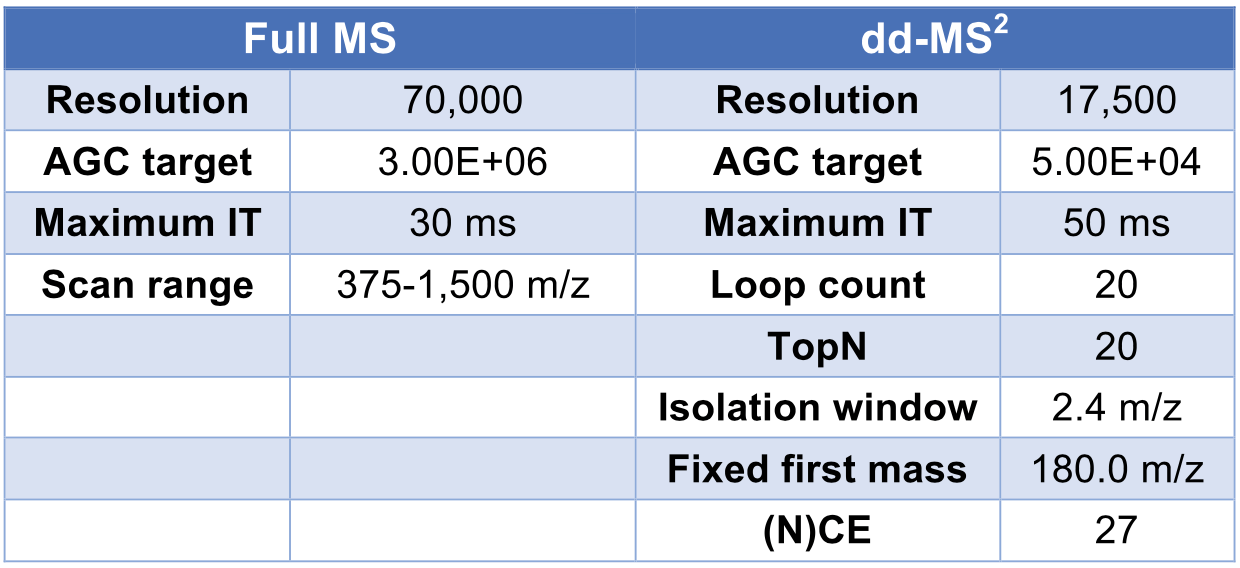
A Thermo UltiMate 3000 nanoUPLC system was used as the LC system. Chromatographic separation was achieved with the conditions shown in Table 1. Data dependent analysis (DDA) was performed on a Thermo Q Exactive TM Plus mass spectrometer with the parame- ters for full MS/dd-MS2 detection shown in Table 2. The position of M3 emitters relative to ion transfer tube was tuned based on the TIC signal and was optimized at about 3 to 4 mm.
Code Analysis
We performed analysis of dynamic range, sensitivity, and robustness using our microflow LC-nanospray MS platform and compared the results to those obtained from microflow LC-MS and nanoLC-MS, respectively. In the study of dynamic range and sensitivity, HeLa protein digests at each concentration were repeated 3 times to obtain an average. In the robustness test, the HeLa protein digest and plasma digest samples were run ~30 times to generate performance statistics, including RSD (relative standard deviation) values for protein groups, protein abundance, and peptide retention time. The MS raw data were loaded onto Proteome Discoverer 2.2.0.388 (Thermo Fisher, USA) and searched against the Swiss-Prot human sequence DBs using SEQUEST HT with 10 ppm of precursor mass tolerance, 0.02 Da of fragment mass toler- ance. Percolator was employed to calculate the protein false discovery rate (FDR) by searching decoy database and the cutoff was FDR = 0.01 (for high-confidence search) and p-value < 0.05.
Results and Discussion
1. MnESI-LC-MS for bottom-up proteomics of HeLa cell lysates
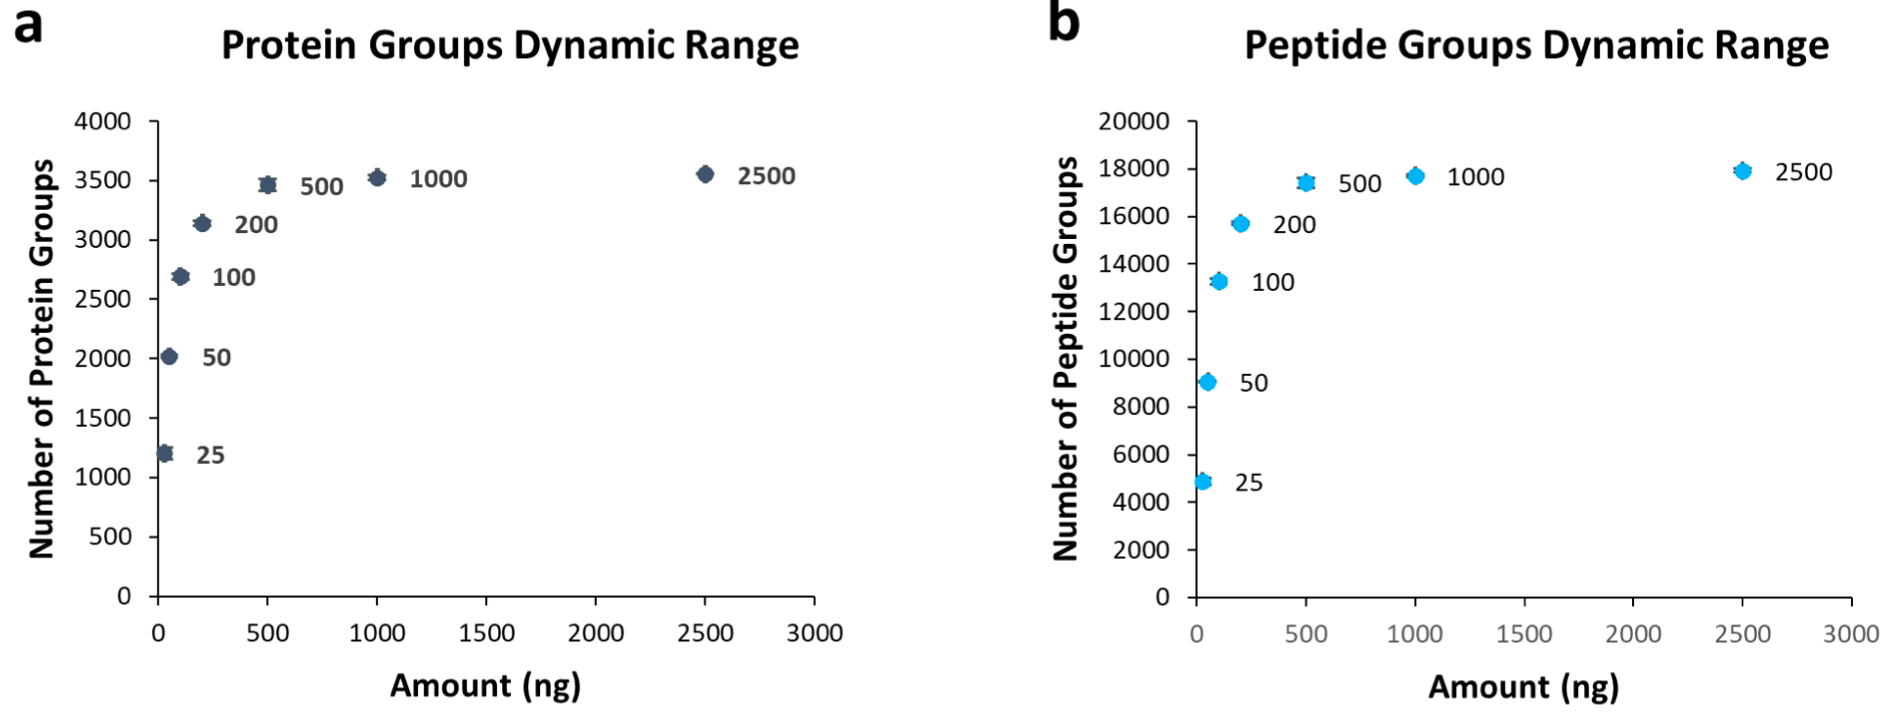
HeLa protein digest was serially diluted from 2,500 ng/mL to 25 ng/mL for the dynamic range study. The flow rate was 1.5 μL/min using the Thermo PepMapTM C18 LC column (2 μm particle size, 150 μm x 150 mm) and M3 Emitter (8 nozzles, 10 μm ID). The numbers of protein group (Figure 1a) and peptide group (Figure 1b) increase significant- ly from 25 to 500 ng injection amount. After 500 ng injection amount, the numbers reached plateaus at ~3,500 protein groups and ~18,000 peptide groups, respectively.
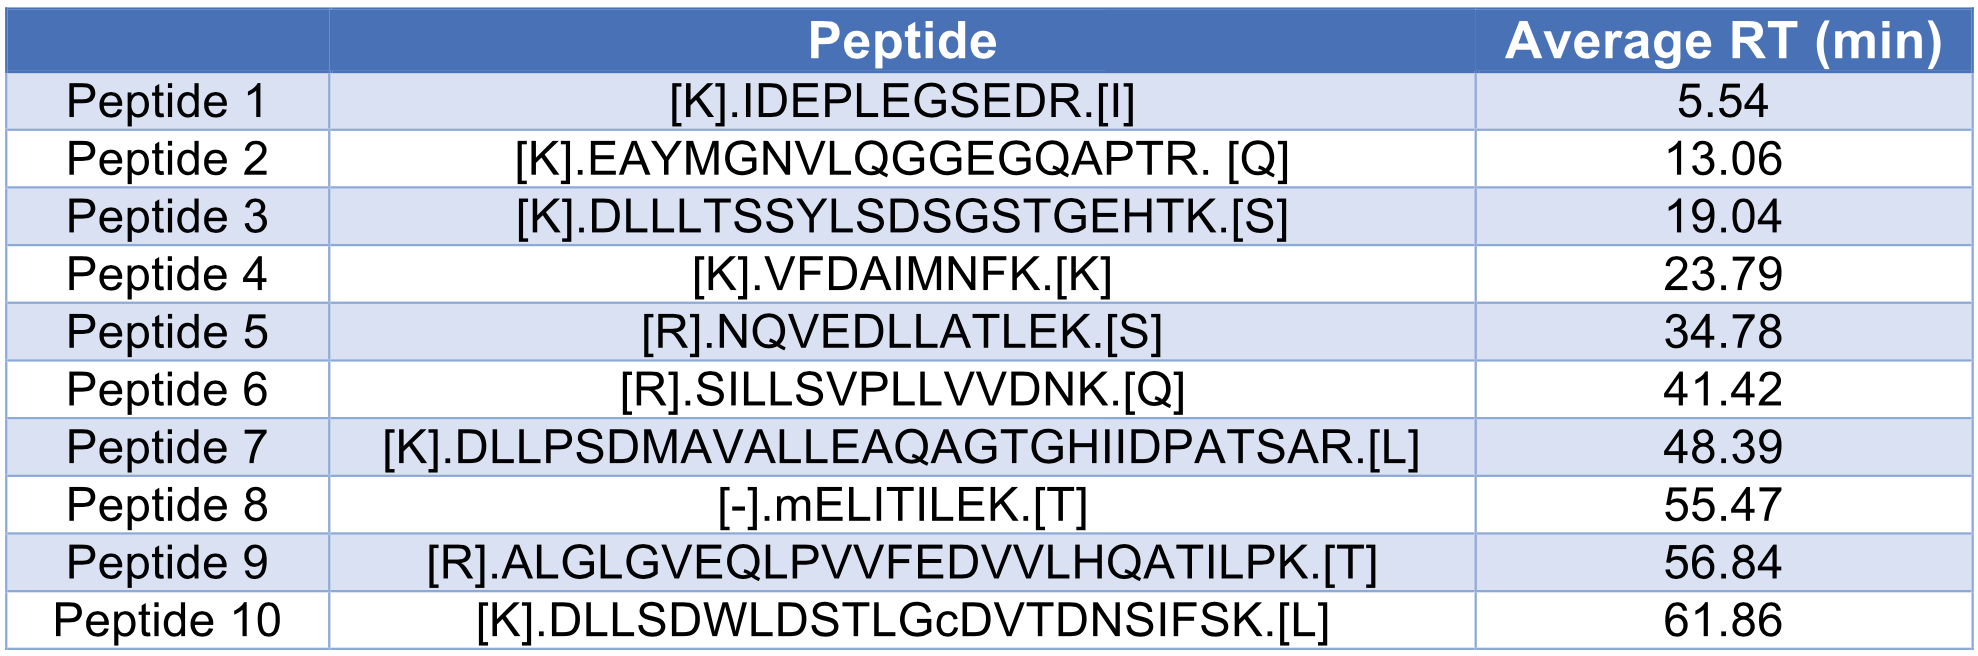
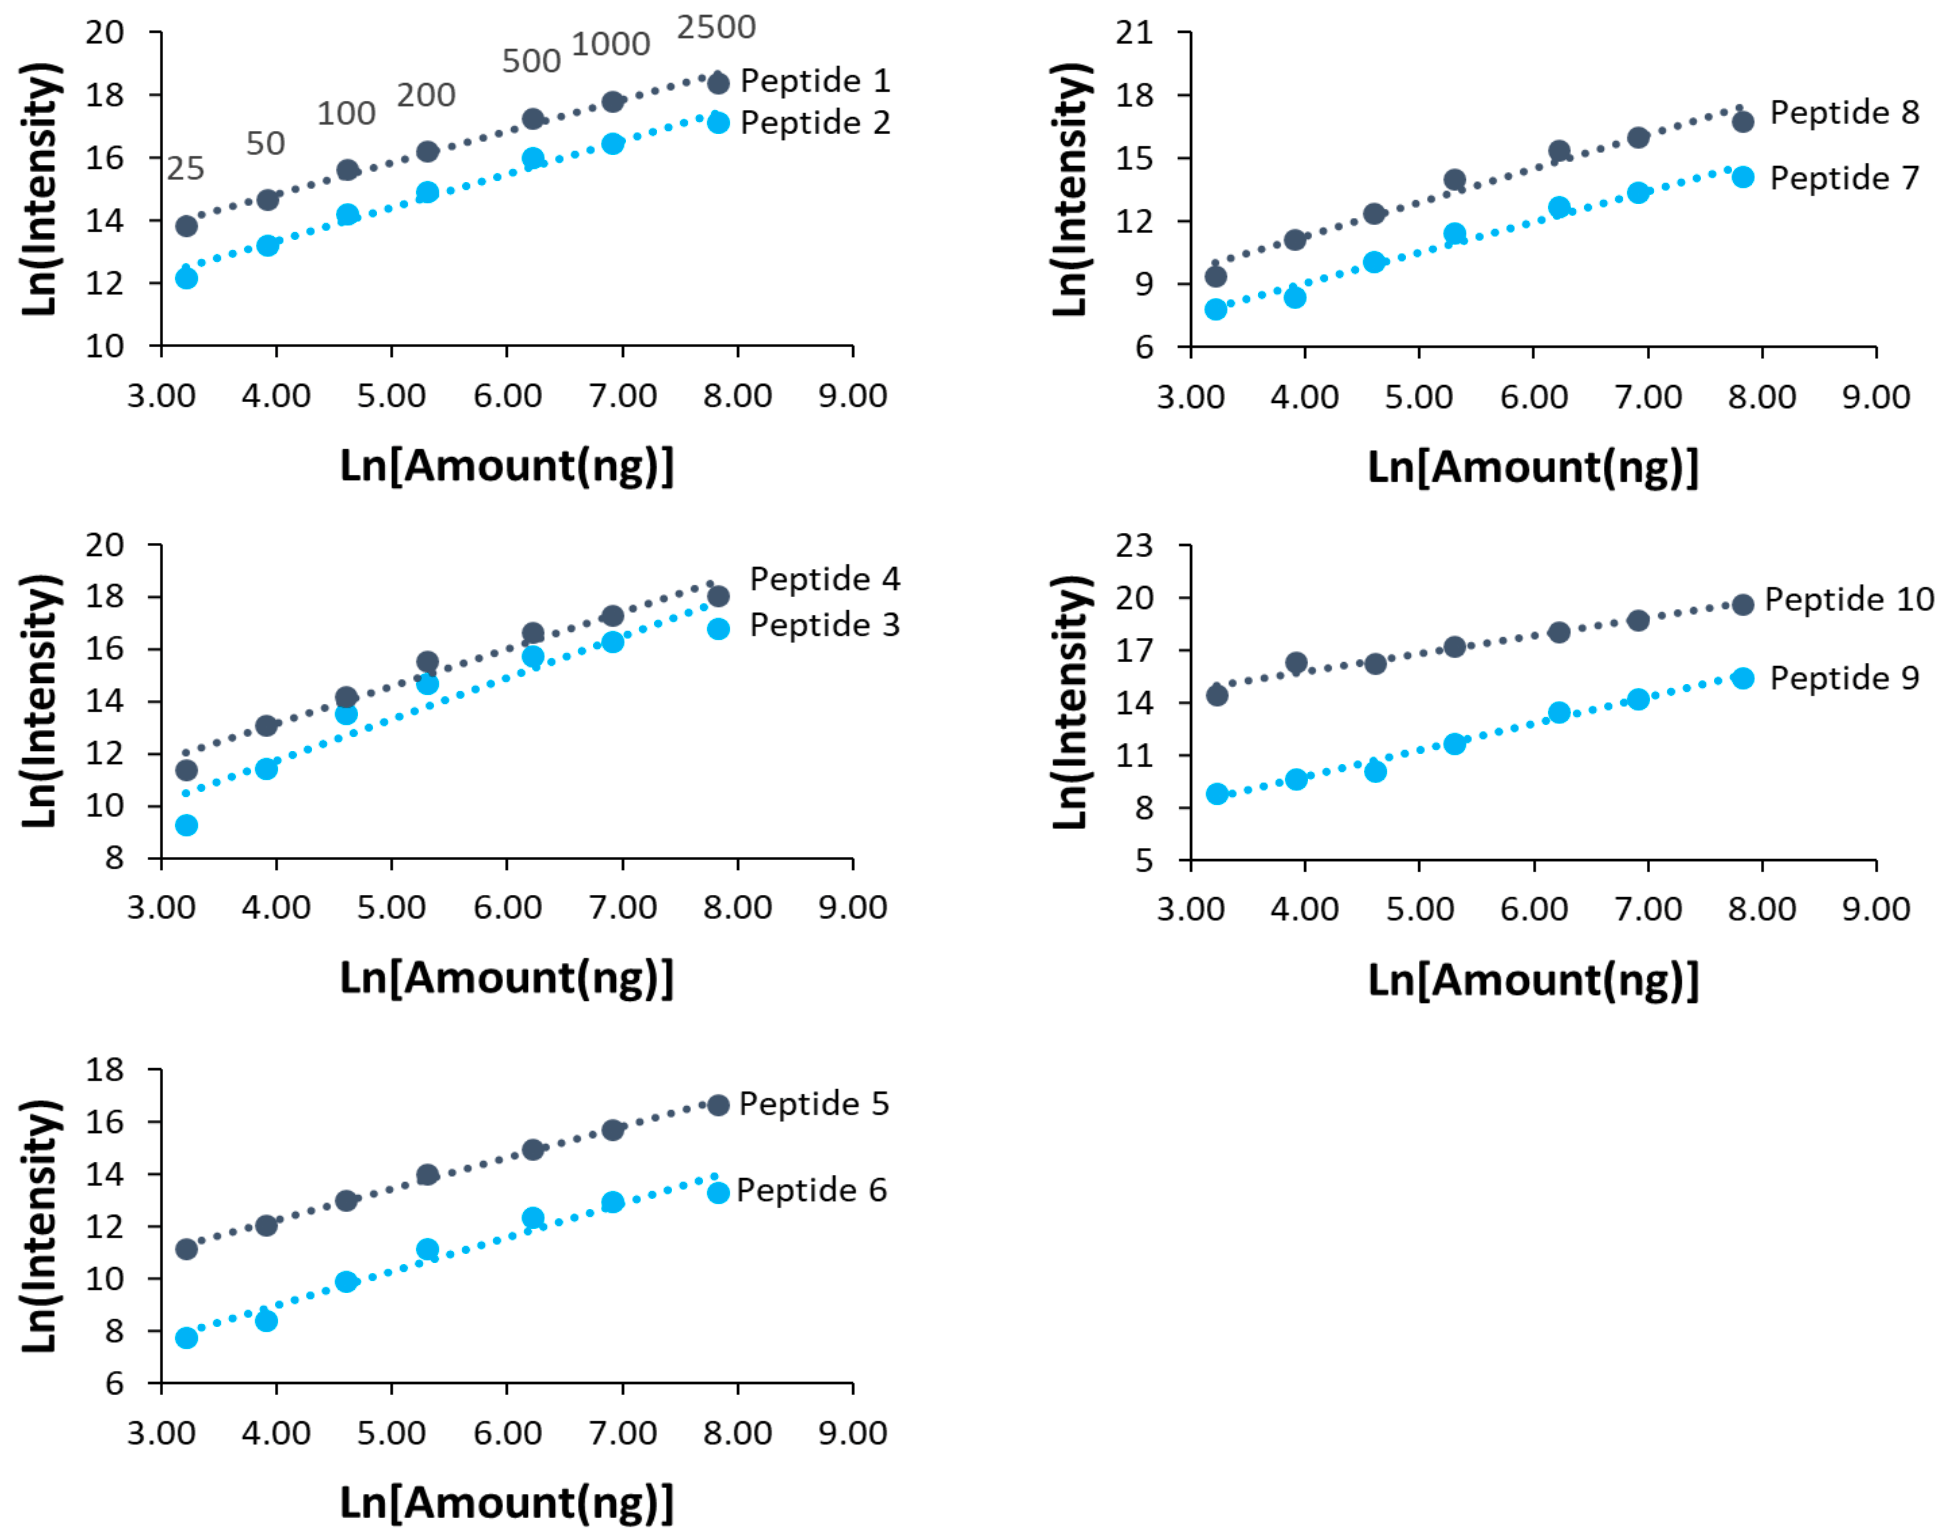
We also studied the dynamic range of 10 selected peptides across the 70 min LC-MS run, with their retention times ranging from 5 min to 60 min (Table 3). All peptides showed a good linearity in their peak area intensities from 25 to 2,500 ng injection of HeLa lysate (Figure 2).
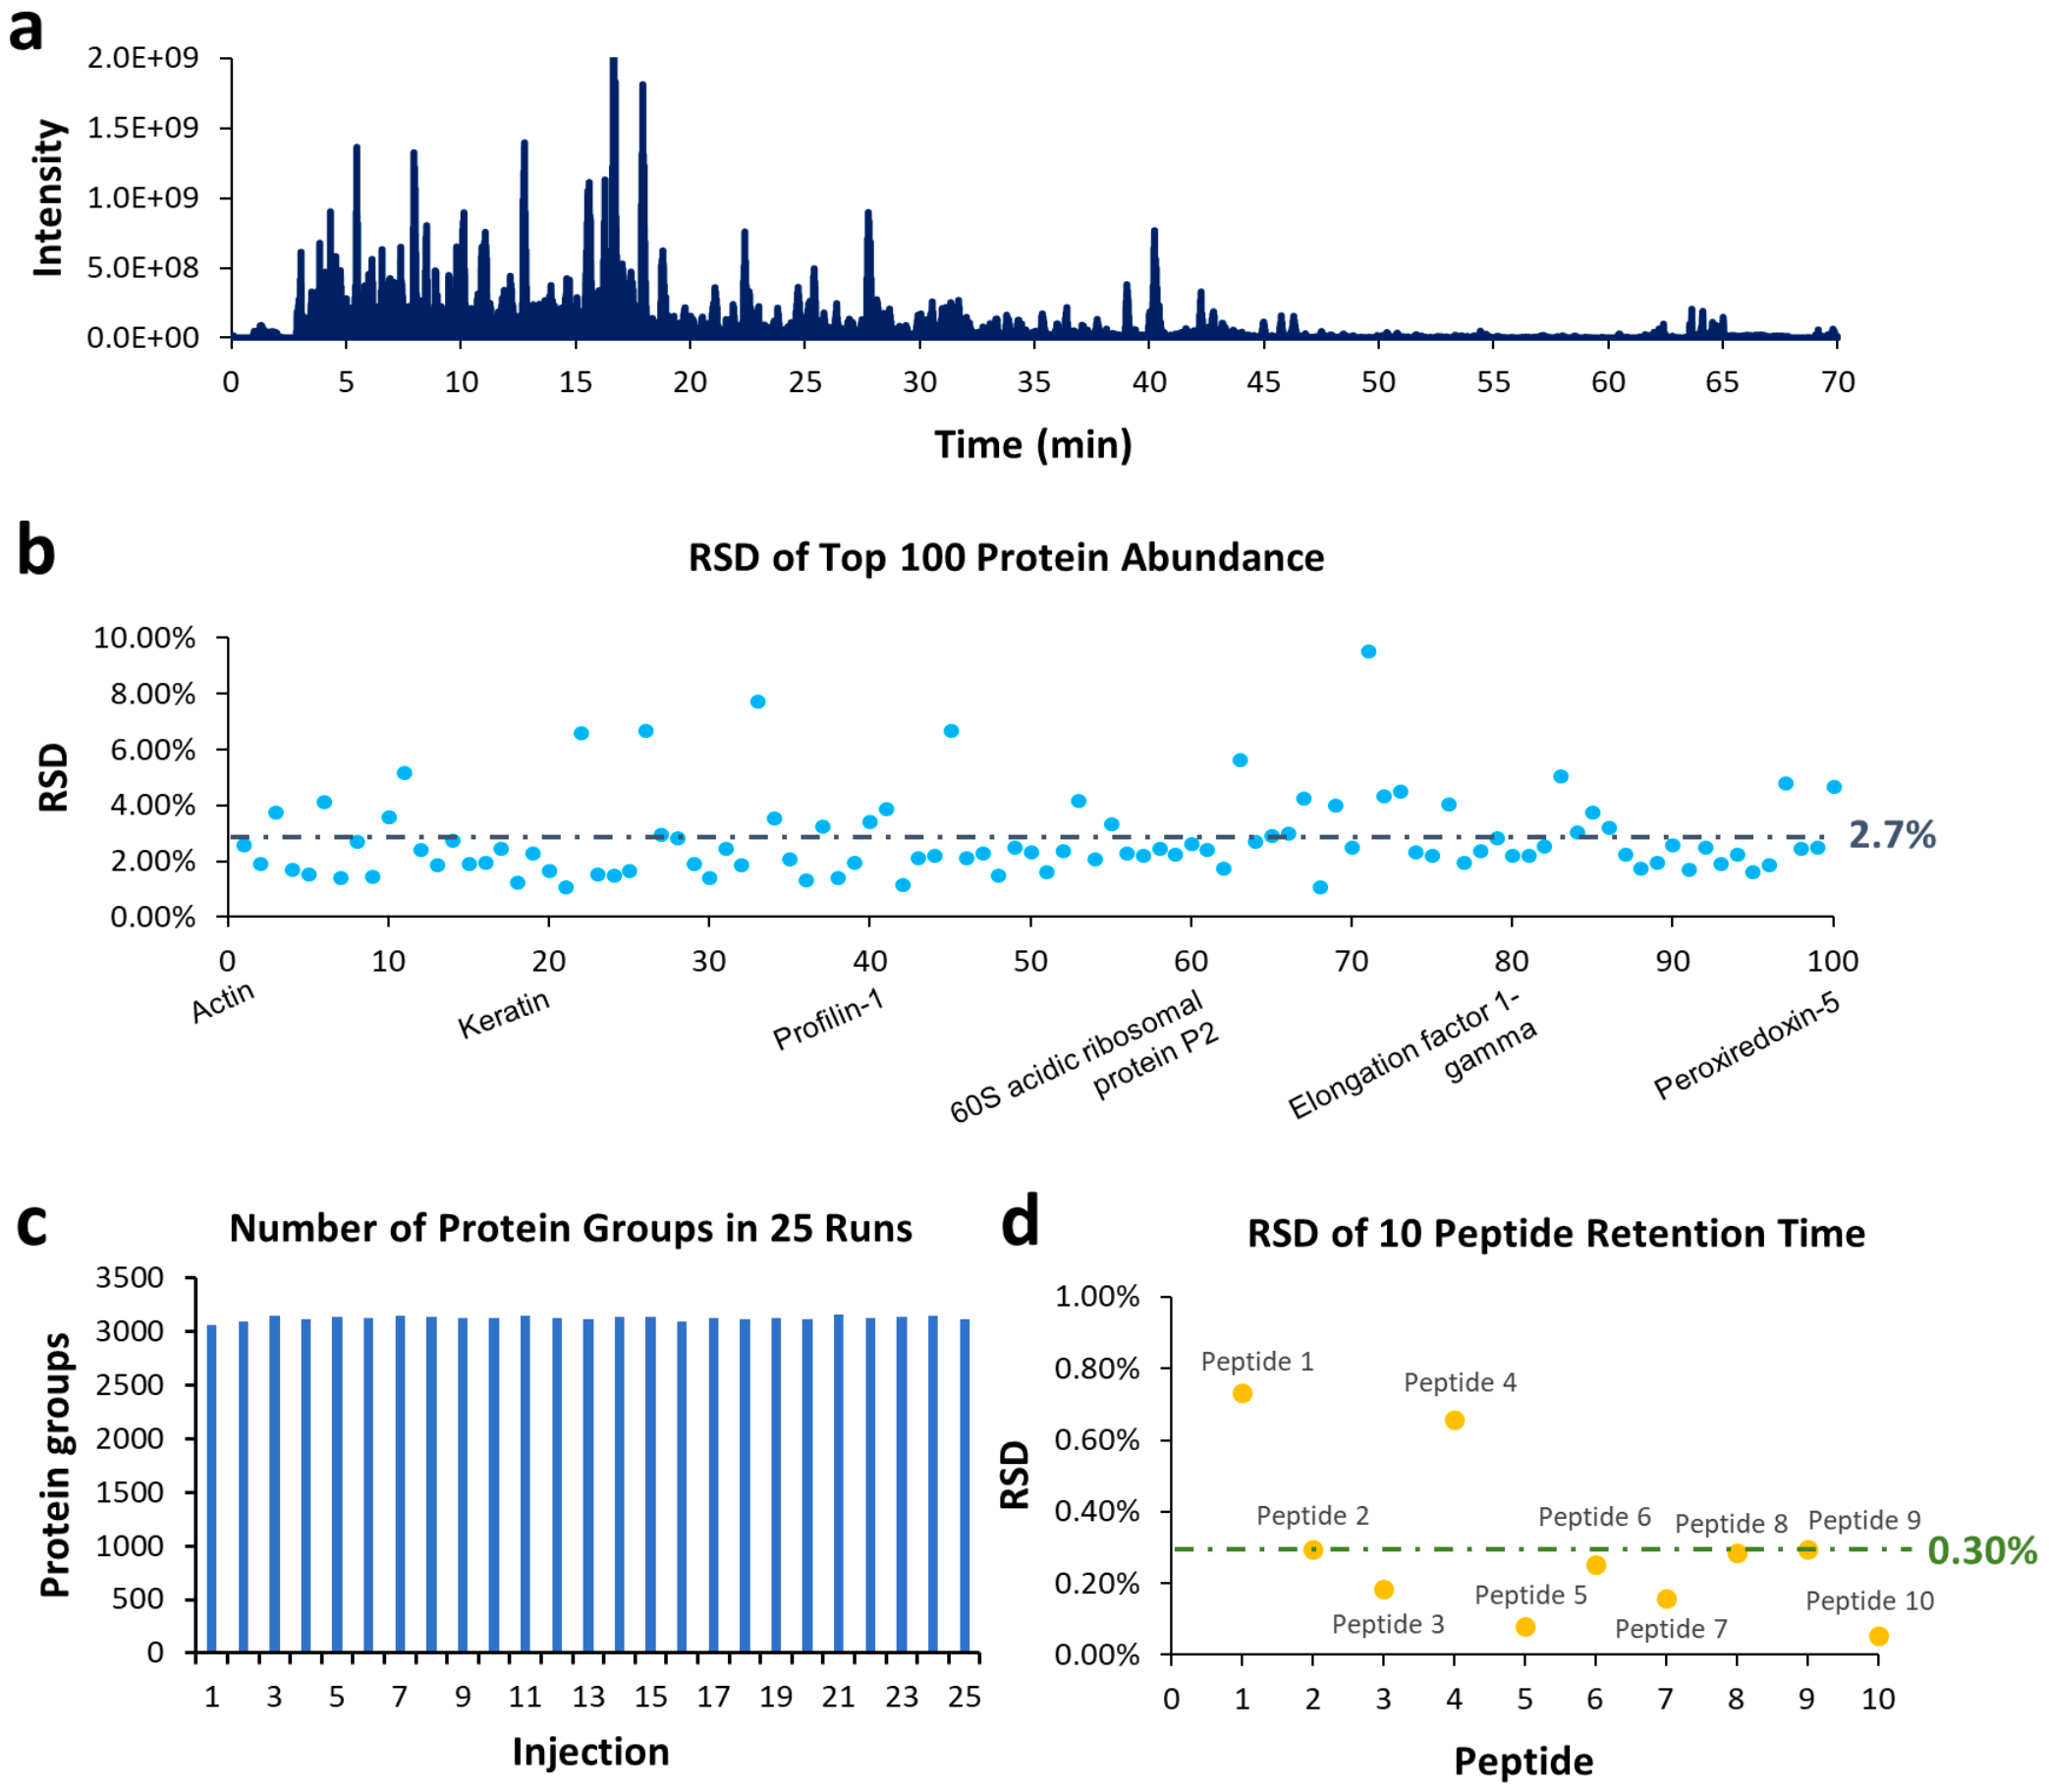
The tryptic digests of HeLa cells (1 μg/run) were injected consecutively for 25 runs to evaluate the robustness of MnESI-LC-MS. Figure 3a shows a representative TIC (Total Ion Chromatogram) from a LC-MS run of HeLa protein digest. Among the 25 replicates, the RSDs of the top 100 most abundant proteins were calculated and shown in Figure 3b. More than 90% of the RSDs were below 5% with an average value of 2.7%. Out of the total 27,587 peptides identified, the average RSD of abundance was 19.1%, and 1,297 peptides had an RSD below 5%.
The number of protein groups discovered from each replicate is plotted in Figure 3c. The average number of protein groups is 3,114 with an RSD of 1.1%, which shows good reproducibility. The retention time of 10 peptides from Table 3 was also studied with their RSDs shown in Figure 3D. All RSDs were below 1%, with an average of 0.30%.
2. MnESI-LC-MS for bottom-up proteomics of human plasma samples
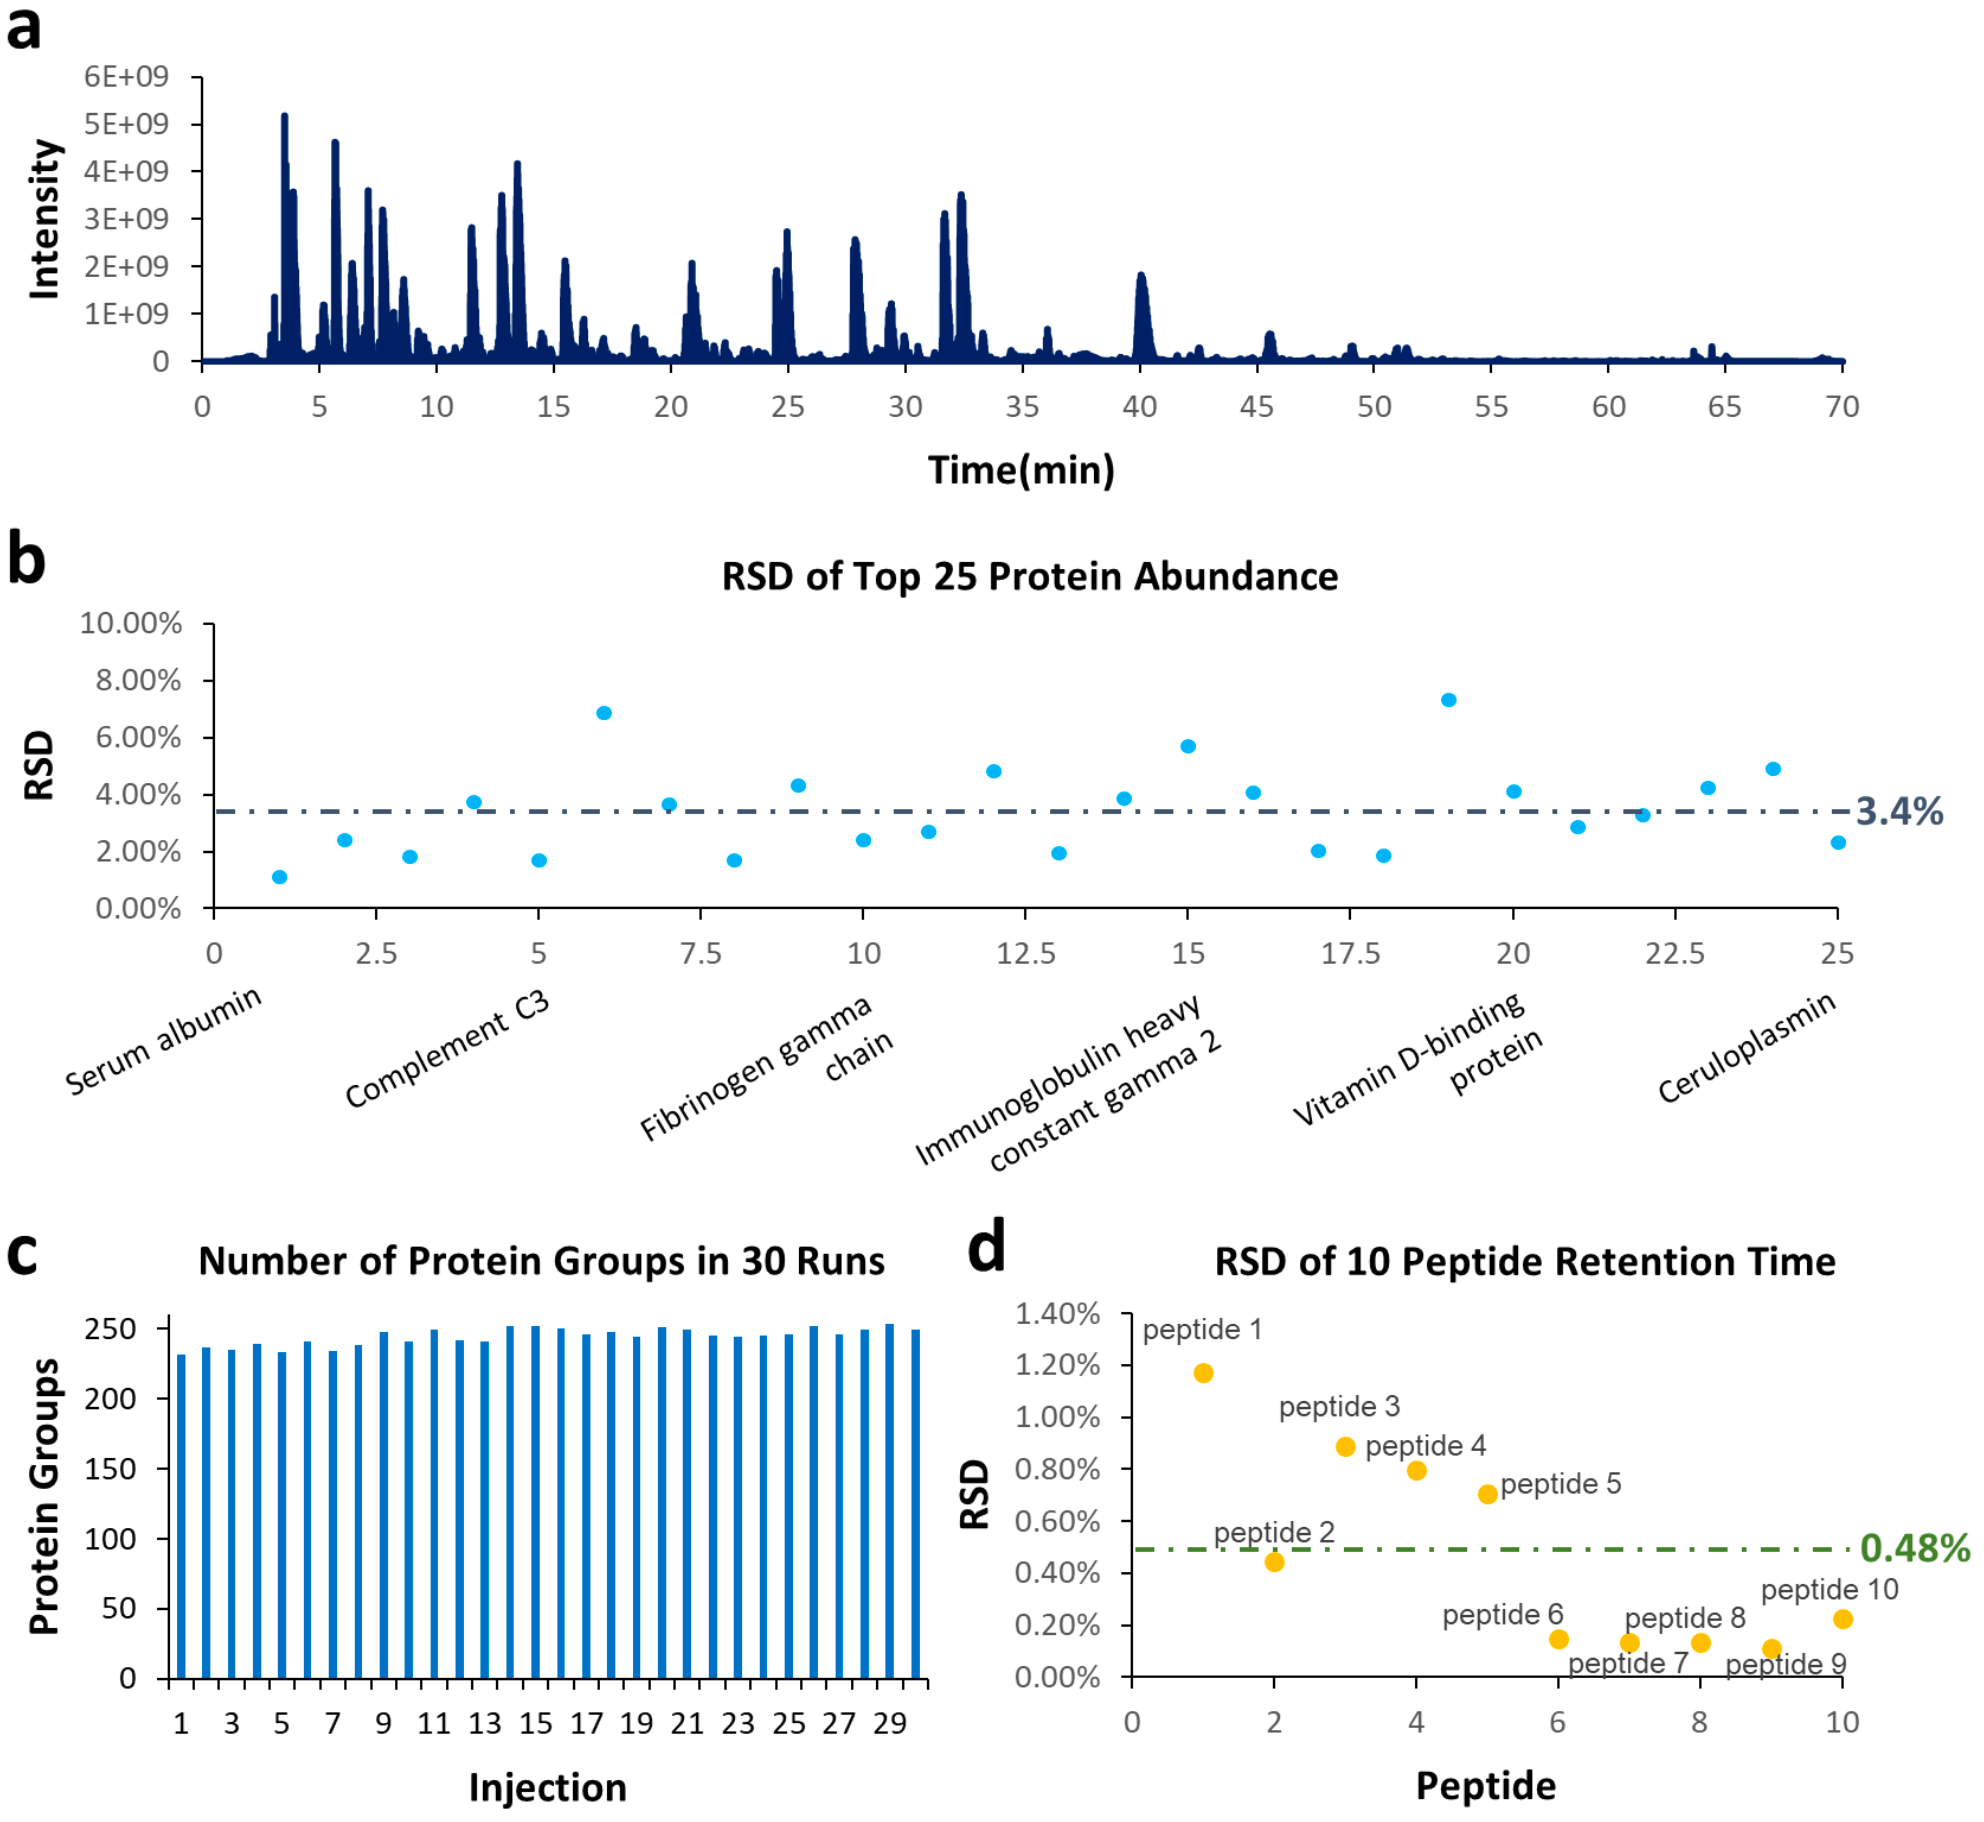
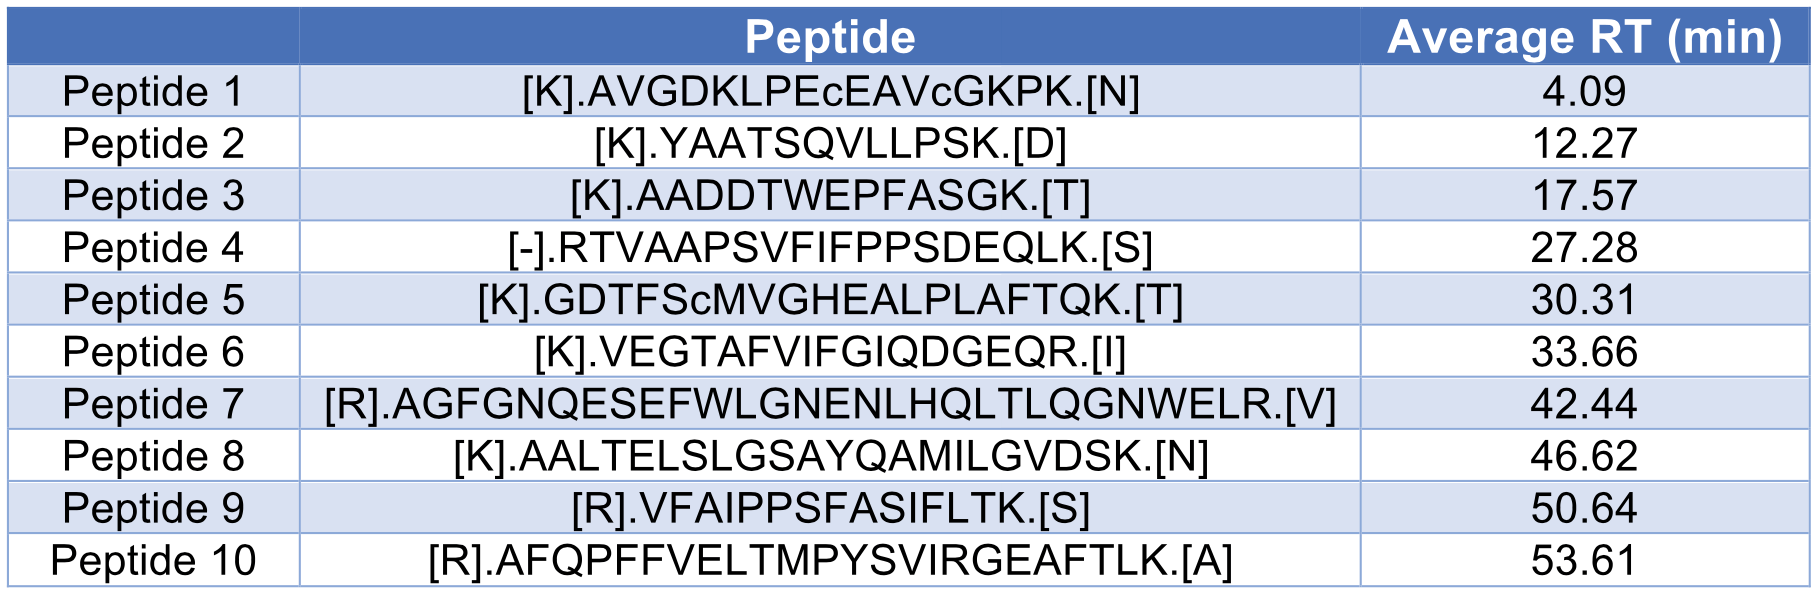
We next performed discovery proteomics studies of human plasma samples for a 1.5 μL/min flow rate. Plasma digests were injected for 30 consecutive runs with the same setup and parameters as those for HeLa digests described above. Figure 4a shows a representative TIC for a 70 min LC-MS run of 1 μg plasma digest at 1.5 μL/min using a M3 Emitter interfaced with a C18 column (150 μm x 150 mm). RSDs of top 25 most abundant proteins were below 10%, with an average value of 2.7% (Figure 4b). The average number of protein groups discovered from 30 injections was 244, with an RSD of 2.5% (Figure 4c). Ten peptides (Table 4) were selected to characterize the reproducibility of their retention times. The RSDs of their retention times were plotted in Figure 4d and the average value was 0.48%.
Conclusions
The Newomics-Thermo MnESI-LC-MS platform, using Newomics® M3 Emitters and Thermo Fisher PepMapTM C18 columns on a Q Exactive™ Plus mass spectrometer, has achieved high-throughput, high-sensitivity, and robustness for bottom-up proteomics studies of complex biological samples including whole cell lysates and human plasma samples.
References
- Kim W., Guo M., Yang P., Wang D., “Microfabricated Monolithic Multinozzle Emitters for Nanoelectrospray Mass Spectrometry,” (2007) Analytical Chemistry, 79(10), 3703-3707.
- Mao P., Wang H.T., Yang P., Wang D., “Multinozzle Emitter Arrays for Nanoelectrospray Mass Spectrometry,” (2011) Analytical Chemistry, 83(15), 6282-6289.
- Mao P., Gomez-Sjoberg R., Wang D., “Multinozzle Emitter Array Chips for Small-Volume Proteomics,” (2013) Analytical Chemistry, 85(2), 816-819.
- ASMS 2018 poster: po-65308-lc-ms-capillary-flow-sensitivity-proteomics-asms2018-po65308-en