Goal
To develop a microflow LC-MS platform for characterization of native monoclo- nal antibody (mAb), that achieves high-throughput, high-sensitivity, and robust- ness using Newomics® M3 emitters interfaced with a Thermo Fisher Orbitrap Q Exactive Plus mass spectrometer.
Introduction
Native mass spectrometry (MS) has emerged as a valuable technique for the characterization of protein conformations and protein complexes that have non-covalently bonded components [1]. This approach has been routinely used in monoclonal antibodies (mAb) analysis, such as therapeutic antibodies, antibody-drug conjugates (ADCs), biosimilars, and bispecific mAbs. Currently high-flow size exclusion chromatography (SEC)-MS has been widely used for native MS analysis of mAb [2-4]. Due to relatively low ionization efficiency at the high (analytical) flow rate, this method may not be sensitive enough to detect proteins with low concentrations. The Newomics award-winning silicon multinozzle emitters (M3 emitters) split the incoming microflow eluent into multiple nanoflows at each nozzle, thereby significantly enhancing the ionization efficiency and reducing the matrix effects for ESI-MS ([5-8] and Newomics Application Notes [9-11]). In this Application Note, we demonstrate a new microflow LC-MS platform for native MS of mAb, using Newomics® M3 emitters interfaced with a Thermo Fisher Orbitrap Q Exactive Plus mass spectrometer.
Methods
1. Sample preparation
The monoclonal antibody was purchased from NIST (SRM 8671). The HPLC-grade water and ammonium acetate (NH4OAc, Cat. # 73594-25G-F) were purchased from Sigma-Aldrich (St. Louis, MO). Aliquoted antibody stored at -80°C freezer was thawed at room temperature and serially diluted into 50 mM – 200 mM NH4OAc solutions before analysis.
2. LC-MS analysis
The microflow SEC chromatography was performed with a 0.3 mm ID PolyHydroxyethylA capillary column (150 x 0.3 mm, PolyLC Cat. # 150.30HY03–10). The high-flow SEC chromatography was performed with a 4.6 mm ID BEH SEC column (150 x 4.6 mm, Waters Cat. # 186005225). The following three types of emitters were used in our studies: a New Objective PicoTip™ emitter (single nozzle, 10 µm ID, catalog #FS360-20-10-D-20 ), a Thermo Fisher stainless steel emitter (NanoTip, single nozzle, 30 µm ID, catalog # NC0379152), a Thermo Fisher high-flow needle insert assembly (HESI high-flow, single nozzle, 100 µm ID, catalog # Opton 53010), a Thermo Fisher low-flow needle insert assembly (HESI low-flow, single nozzle, 75 µm ID, catalog # Opton 53011), and a Newomics® M3 emitter (8 nozzles, 10 µm ID, catalog # E8N10MU01).
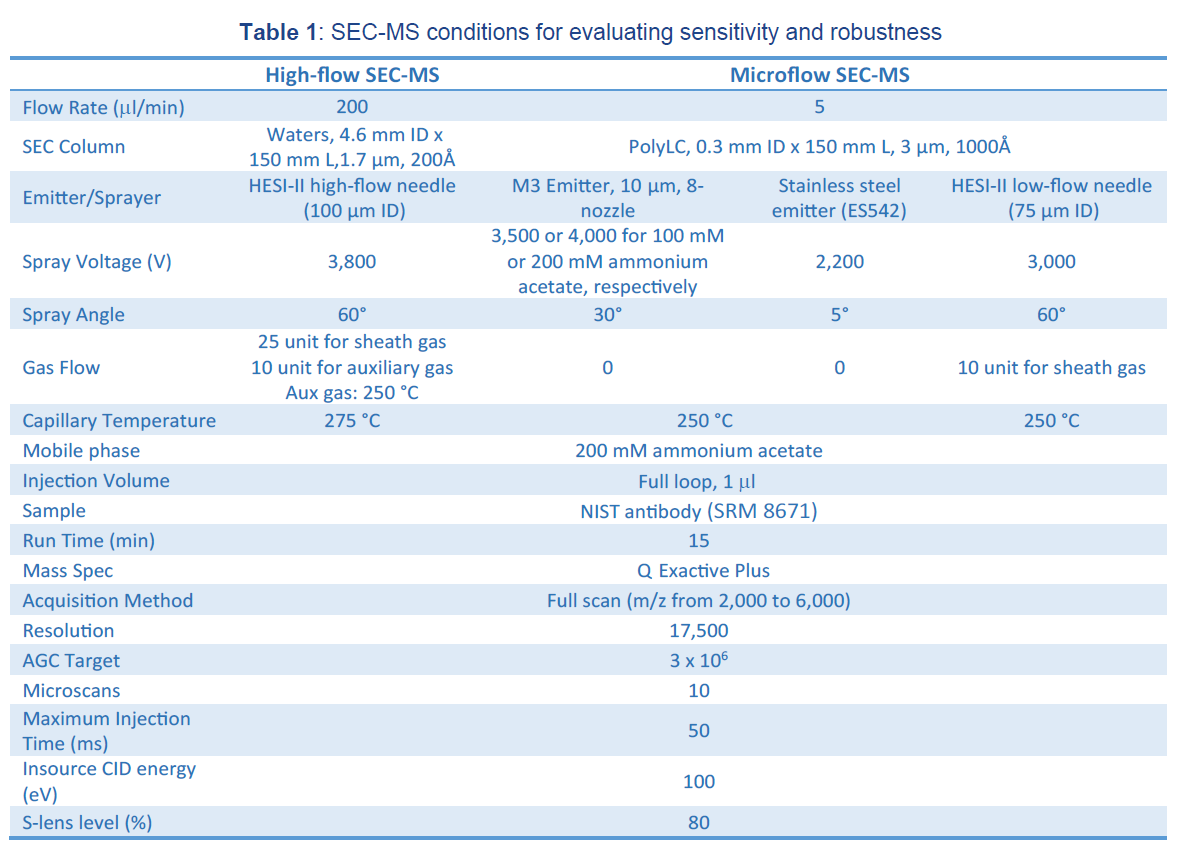
Mass spectra were acquired on a Thermo Fisher Orbitrap Q Exactive Plus mass spectrometer interfaced with an UltiMate 3000 RSLCnano UPLC system (Thermo Fisher Scientific). The conditions for mass spectrometer settings were listed in Table 1. For PicoTip, NanoTip, and M3 emitter, the electrospray voltage was optimized at a distance of ~2.4 mm from the ion transfer tube and set at 1.8 kV for PicoTip, 2.2 kV for NanoTip, and 3.5-4.0 kV for M3 emitters, respectively. For the HESI needle, the electro- spray voltage was optimized at 3.0 kV for HESI microflow, 3.8 kV for HESI high-flow. The ion transfer tube temperature was set at 250 °C for microflow and 275 °C for high-flow. Desolvation gas was not used for M3 emitters in this application note in order to maximize the detection sensitivity of native antibodies.
3. Data analysis
Data were analyzed using Xcalibur software and Biopharma Finder 2.0 software (Thermo Fisher Scientific). The quantification of different IgG proteo- forms was processed by Biopharma Finder 2.0 at multiconsensus option. The ReSpect function was used for deconvolution of isotopically unresolved mass spectra of the intact protein under native conditions.
Results and Discussion
1. Optimization of microflow SEC-MS for analysis of native monoclonal antibody
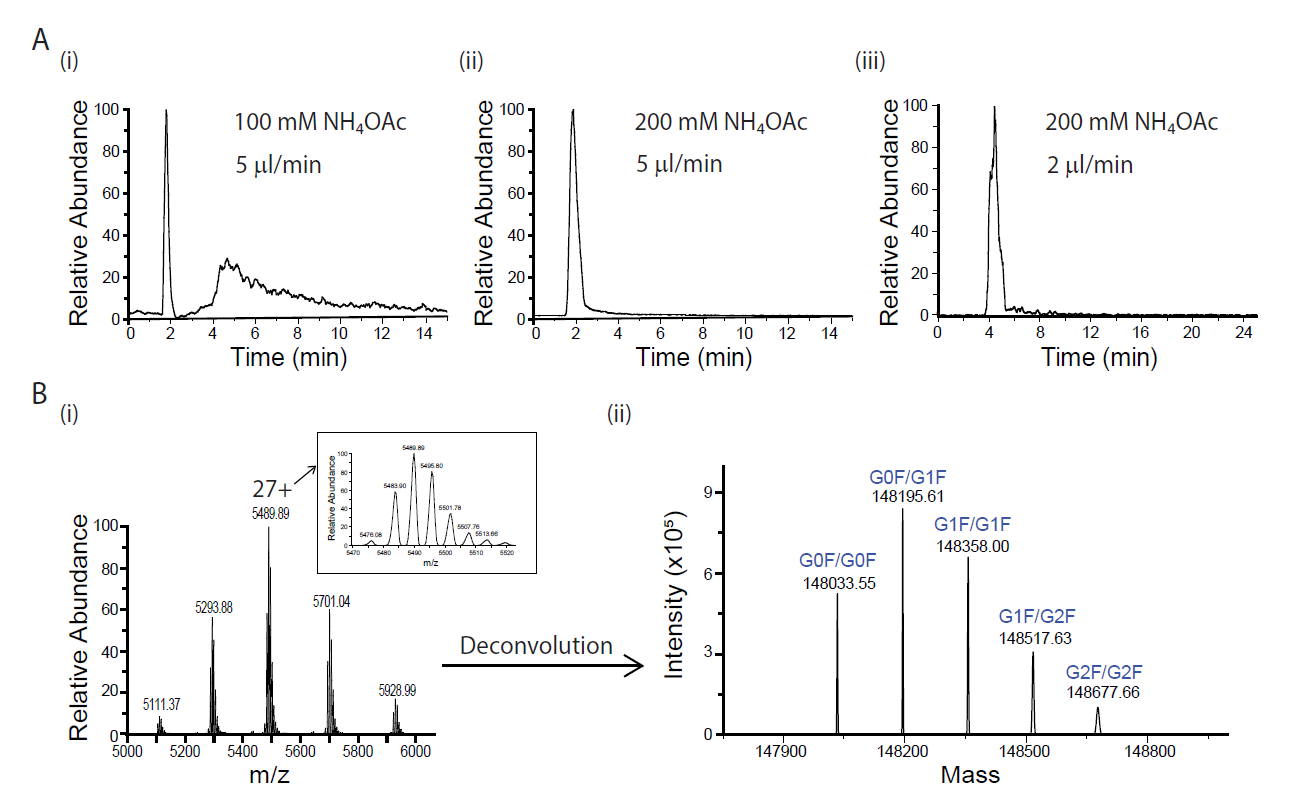
We optimized microflow SEC-MS conditions for analysis of native mAb using the microflow PolyLC column interfaced with a QE Plus mass spectrometer. We found that the lower salt concentration at 100 mM NH4OAc resulted in a significant IgG peak tailing, whereas this peak tailing was effectively suppressed at 200 mM NH4OAc (Figure 1A [i] and [ii]). Therefore, 200 mM NH4OAc was used for the native NIST mAb analysis in this study. We also tested the effect of different flow rates on SEC performance. Good LC peak shapes were obtained at 2 to 5 µl/min flow rate range. At 5 µl/min, the retention time of the mAb peak was within 2 min, whereas it was more than 4 min at 2 µl/min, (Figure 1A [ii] and [iii]). Therefore 5 µl/min was chosen as the default micro-flow rate for the higher throughput. For protein quantification, we used BioPharma Finder 2.0 to do the charge deconvolution (Figure 1B [i]-[ii]). The most abundant 5 glycoforms of NIST mAb were quantified to compare the performance of different emitters (Figure 1B [ii]).
2. Improvement in detection sensitivity and preservation of native state for monoclonal antibody analysis using M3 emitters
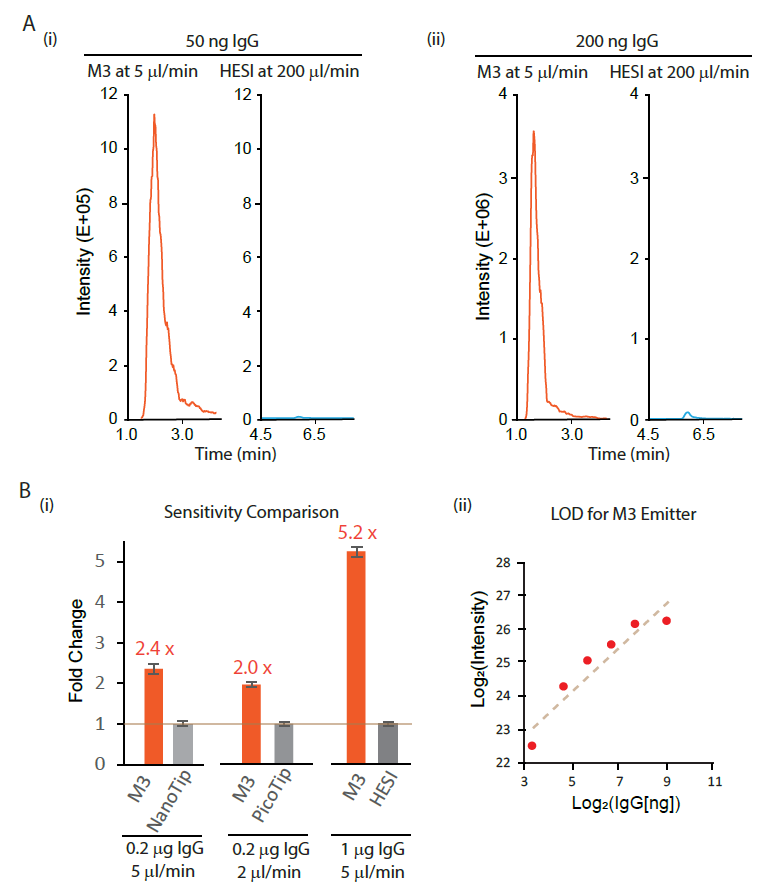
We examined the sensitivity gain of M3 multinozzle emitters over the conventional single-nozzle emitters. First, we compared the sensitivity gain of microflow SEC-MS using an M3 emitter over the traditional high-flow SEC-MS by HESI under the optimized conditions for each analysis. We demonstrated more than 10-fold sensitivity gain of microflow SEC-MS by M3 over high-flow SEC-MS by HESI using various amounts of IgG (Figure 2A). In addition, the IgG retention time from microflow SEC using M3 emitter was significantly earlier than that from high-flow using HESI (Figure 2A), suggesting a possible higher throughput for microflow SEC-MS.
We then compared M3 emitters with other single-nozzle emitters for microflow SEC-MS. We compared M3 emitters with NanoTip, PicoTip, and HESI, coupled with the same SEC column. For the comparison to PicoTip, we chose a 2 µl/min flow rate due to the high back pressure from the single nozzle 10 mm ID PicoTip for higher flow rates. On average, we observed a 2.4-fold sensitivity gain of M3 emitters over NanoTip at 5 µl/min, a 2-fold sensitivity gain over PicoTip at 2 µl/min, and a 5.2-fold sensitivity gain over HESI at 5 µl/min (Figure 2B [i]). We next measured the limit of detection (LOD) for microflow SEC-MS analysis of native IgG using M3 emitters. A dilution curve analysis shows excellent linearity of MS signals on the mAb amount from 25 to 200 ng, with a LOD value below 10 ng IgG (Figure 2B [ii]).
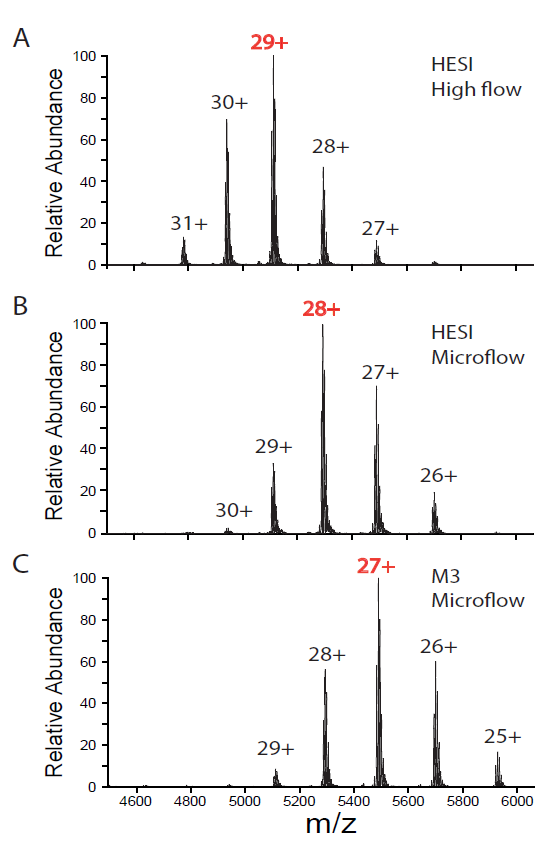
Interestingly, we observed that compared to microflow and high-flow SEC-MS both by HESI, the charge envelope of IgG from microflow SEC-MS by M3 emitters shifted towards the higher m/z range (Figure 3), with the corresponding most abundant charge state evolving from 29+ for HESI at high-flow, to 28+ for HESI at microflow, and 27+ for M3 emitter at microflow. This suggests better preservation of the native conformation of IgG at microflow, especially for M3 emitters. We speculated that high sheath gas flow or heated auxiliary gas flow often needed for HESI needle to achieve better desolvation and detention sensitivity might have contributed to the partial unfolding of a small population of native IgG. In contrast, our M3 emitters with 10 mm ID nozzle operated at microflow LC but with electrospray at nanoflow might result in “softer” electrospray ionization of native IgG. This observation is significant because maintaining the native state of mAb will be critical to studying the interactions between mAb and target ligands (proteins, small molecules, etc.) in the gas phase.
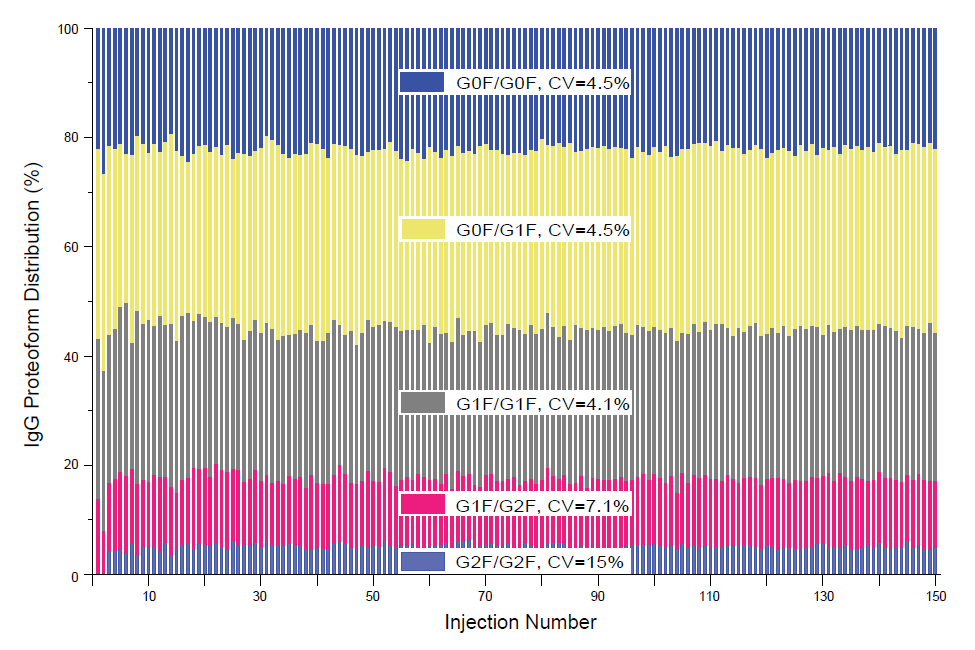
We have also performed the robustness assessment of microflow SEC-MS for native mAb analysis by M3 emitters. All five M3 emitters were tested and went through the consecutive 150 injections without any significant decrease in sensitivity. Figure 4 shows the representative results from one M3 emitter for 150 consecutive SEC-MS runs. For the five most abundant IgG proteoforms shown in Figure 1 B[ii], the CVs of the percentage of the three major glycoforms (G0F/G0F, G0F/G1F, and G1F/1F) are within 5%, while the other two less abundant ones (G1F/G2F and G2F/G2F) are 7% and 15%, respectively (Figure 4).
3. Integration of M3 emitters with the high-flow SEC by flow splitting for enhanced sensitivity
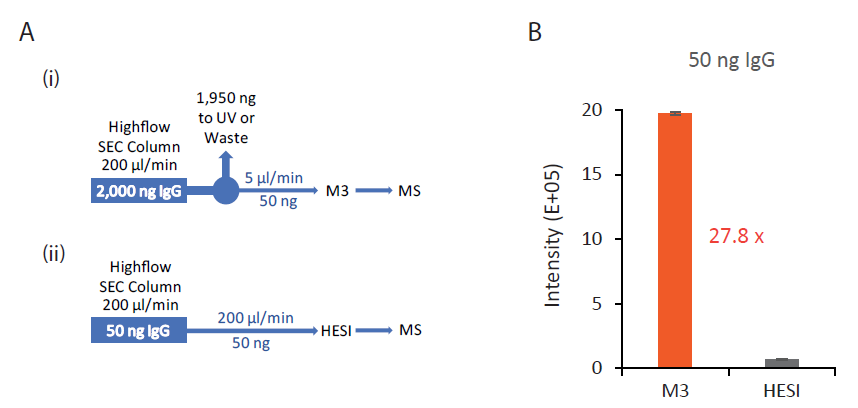
Since the current workflow for native MS analysis of IgG is high-flow SEC-MS by HESI, we evaluated the performance of coupling M3 emitters with a high-flow SEC column. A simple T-splitter was used to split the analytical flow of 200 µl/min after an SEC column down to a microflow of 5 µl/min, which entered an M3 emitter for spray into MS (Figure 5A). Compared to the conventional high-flow method without splitting, this new method by flow splitting to M3 emitters achieved an on average 27.8-fold sensitivity gain, assuming the same amount (50 ng, e.g.) of IgG delivered to MS (Figure 5B). This M3 workflow with high-flow splitting allows simultaneous detection of mAb by UV and MS without the need to change the LC system. In addition, the majority of the IgG injected onto the high-flow column is diverted to waste rather than going into the mass spectrometer, minimizing the contamination of ion cone and S-lens of the QE instrument.
Conclusions
We have established a new microflow LC-MS platform for native MS studies of monoclonal antibodies. By interfacing to an orbitrap Q Exactive Plus mass spectrometer, Newomics® M3 emitters have achieved high throughput, high sensitivity, and robustness for native MS of mAb. We demonstrate the following significant advantages of our microflow SEC-MS platform using M3 emitters compared to the traditional high-flow SEC-MS platform using HESI:
- More than 10-fold sensitivity
- Better preservation of the native conformation of
- The flexibility of upstream and downstream analysis of mAb including flow splitting for simultaneous detection of mAb by UV and MS
References
- Gil, et al. (2017) Proteoform-Specific Protein Binding of Small Molecules in Complex Matrices. ACS Chem Biol 12 (2), 389-397.
- Ren, et al. (2019) Quantitative Determination of Protein-Ligand Affinity by Size Exclusion Chromatography Directly Coupled to High-Resolution Native Mass Spectrometry. Anal Chem 91 (1), 903-911.
- Yan, et al. (2019) Coupling Mixed-Mode Size Exclusion Chromatography with Native Mass Spectrometry for Sensitive Detection and Quantitation of Homodimer Impurities in Bispecific IgG. Anal Chem 91 (17), 11417-11424.
- Jones, J. et al. (2020) Native size-exclusion chromatography-mass spectrometry: suitability for antibody-drug conjugate drug-to-antibody ratio quantitation across a range of chemotypes and drug-loading MAbs 12 (1), 1682895.
- Kim, et al. (2007) Microfabricated monolithic multinozzle emitters for nanoelectrospray mass spectrometry. Anal Chem 79 (10), 3703-7.
- Mao, P. et al. (2011) Multinozzle emitter arrays for nanoelectrospray mass spectrometry. Anal Chem 83 (15), 6082-9.
- Mao, P. et al. (2013) Multinozzle emitter array chips for small-volume proteomics. Anal Chem 85 (2), 816-9.
- Chen, et al. (2018) Quantitation of Intact Proteins in Human Plasma Using Top-Down Parallel Reaction Monitoring-MS. Anal Chem 90 (18), 10650-10653.