Goal
To develop a direct-infusion ESI-MS platform for shotgun lipidomics of human plasma sample, that achieves high-throughput, high-sensitivity, and robustness using Newomics® M3 emitters interfaced with a triple Quadrupole mass spectrometer.
Introduction
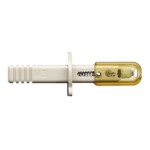
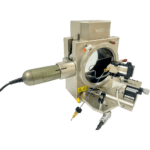
Shotgun lipidomics by ESI-MS is widely used for the global analysis of lipids in biological samples such as human plasma. Direct-infusion ESI-MS by nanoflow (flow rate < 1 µL/min) is routinely performed to achieve high sensitivity for identifying and quantifying hundreds of lipid species in small volumes of samples. Current single-nozzle emitter technologies including PicoTip1•2•3•A and NanoTip5 have been utilized for shotgun lipidomics at the nanoflow. The Newomics award-winning silicon multinozzle emitters (M3 emitters) split the incoming nanoflow eluent into multiple sub- nanoflows at each nozzle, thereby significantly enhancing the ionization efficiency and reducing the matrix effects for ESI-MS6•7•8•9•10.
In this Application Note, we demonstrate the optimization of sensitivity, throughput, and robustness for shotgun lipidomics of human plasma samples, using Newomics® M3 emitters interfaced with a Thermo Fisher TSQ Quantiva™ mass spectrometer. The identification and quantification of 577 lipid species from 12 classes in 5 µL human plasma were achieved using precursor and neutral loss modes in a 30-min scan.
Methods
1. Sample preparation
Pooled human plasma samples (NIST SRM1950) were thawed at room temperature before lipid extraction. The solvents including chloroform, isopropanol, water, and methanol were HPLC-grade and purchased from Sigma-Aldrich (St. Louis, MO). The lipid standards other than free fatty acids were purchased from Avanti Polar Lipid (Alabaster, AL). The isotope-labeled free fatty acids, DHA d5, EPA d5, and AA d11, were purchased from Sigma-Aldrich (St. Louis, MO).
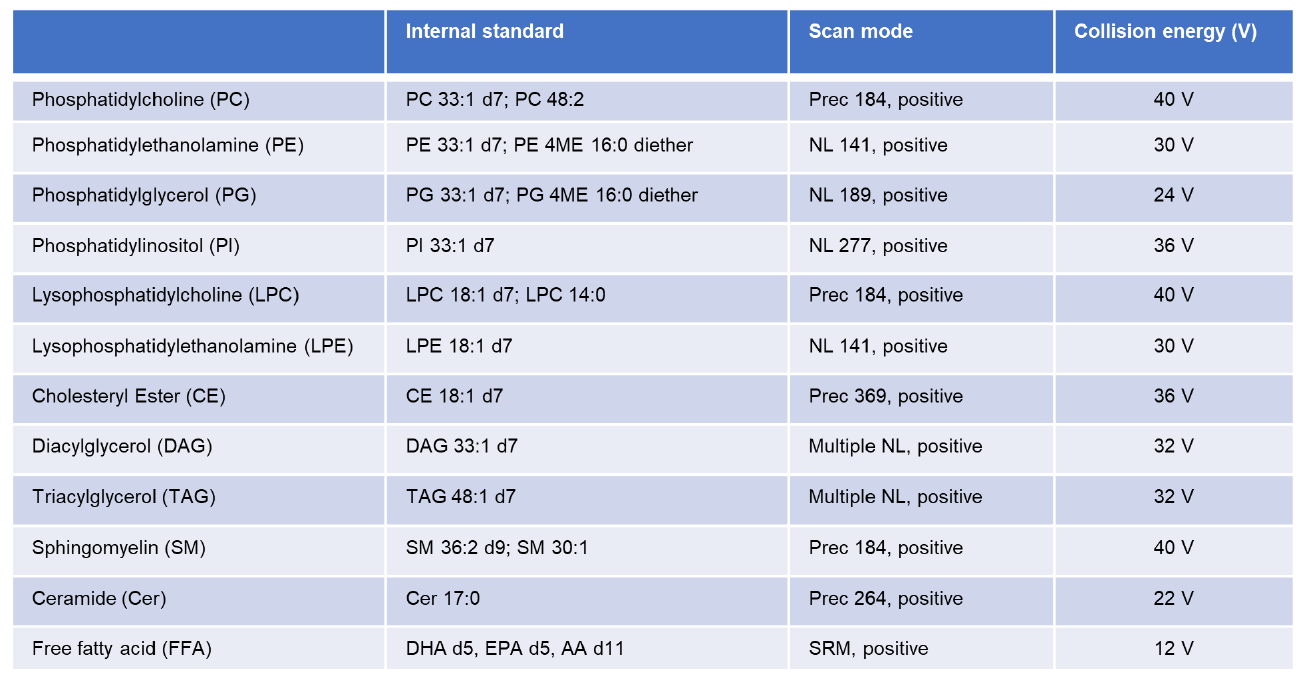
The other lipid internal standards are PC 33:1 d7, PC 48:2, PE 33:1 d7, PE 4ME 16:0 diether, PG 33:1 d7, PG 4ME 16:0 diether, PI 33:1 d7, LPC 18:1 d7, LPC 14:0, LPE 18:1 d7, CE 18:1d7, DAG 33:1 d7, TAG 48:1 d7, SM 36:2 d9, SM 30:1, and Cer 17:0. Total lipids were extracted from 5 µL plasma using a modified Bligh & Dyer method11. The extracted total lipids were dried under gas nitrogen and reconstituted in acetonitrile: isopropanol: water (65:30:5, v/v/v, 7.5 mM ammonium formate) for direct infusion ESI-MS.
2. Mass spectrometry analysis
ESI-MS/MS mass spectra were acquired on a Thermo Fisher TSQ Quantiva triple quadrupole mass spectrometer interfaced with an UltiMate 3000 RSLC nano UPLC system (Thermo Fisher Scientific). The conditions for mass spectrometer settings were listed in Table 1. The 12.5 µL lipid sample was continuously infused into the mass spectrometer at a flow rate of 500 nL/min through a New Objective PicoTip™ emitter (single nozzle, 30 µm ID, catalog # FS360-50-30-D20), a Thermo Fisher stainless steel emitter (NanoTip, single nozzle, 30 µm ID, catalog # NC0379152), or a Newomics® M3 emitter (8 nozzles, 10 µm ID, catalog # E8N10MU01). The infusing solvent consisted of acetonitrile: isopropanol: water (65:30:5, v/v/v) and 7.5 mM ammonium formate, which was the same as the sample solvent. The scan rate was 1000 Da/sec. Collision-induced dissociation (CID) gas was set at 0.5 mTorr.
No source fragmentation voltage was applied. The ion transfer tube temperature was set at 300 °C and the electrospray voltage was optimized and set at 1.8 kV for PicoTip, 2.2 kV for NanoTip, and 3.5 kV for M3 emitter, respectively. Different classes of lipids were scanned at different modes. Precursor ion scan (Prec184) was applied to detect PC, LPC, and SM. A neutral loss scan (NL141) was applied to detect PE and LPE. The PI, PG, CE, and Cer were detected at NL277, NL189, Prec369, and Prec264, respectively. The collision energy applied in each scan mode was 40 V (Prec184), 30 V (NL141), 36 V (NL277), 24 V (NL189), 36 V (Prec369), and 22 V (Prec264), respectively.
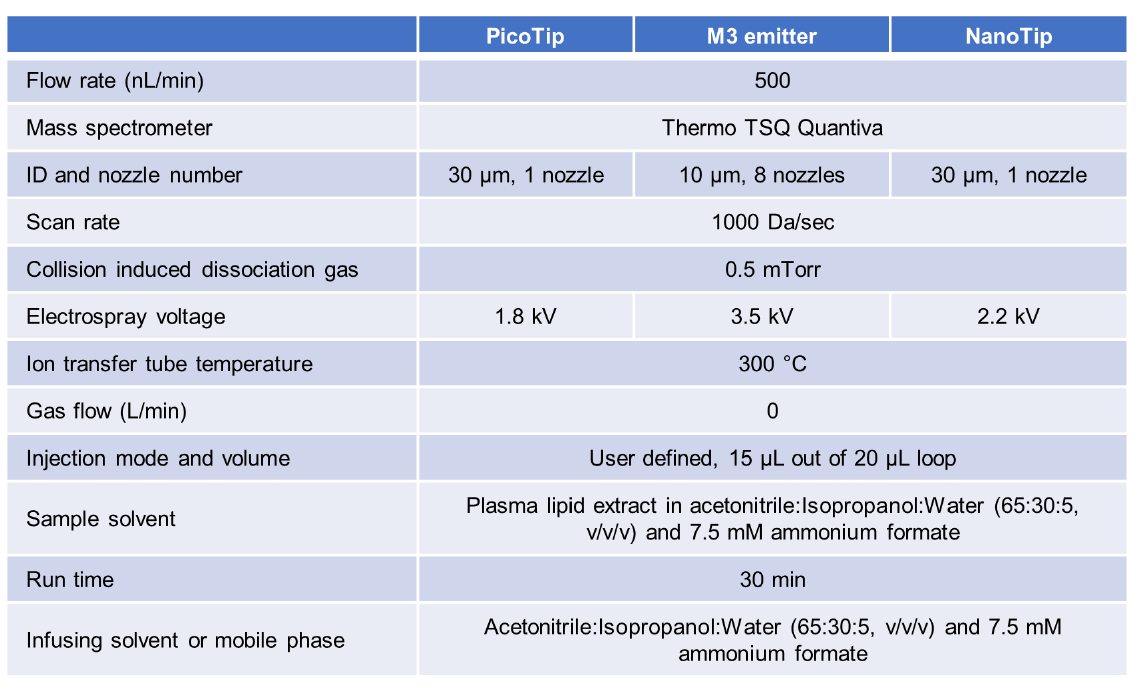
DAG and TAG were scanned by the neutral loss of fatty acyl residues. These multiple neutral loss scans of fragmentation enabled the quantification of isobaric TAG species12′ 13′ 14. The collision energy for the loss of fatty acyl residues was 32 V. The mass analyzers were adjusted to achieve a resolution of 0.7 atomic mass (am) unit full width at half height.
3. Lipid identification and quantitation
The lipid internal standards and parameters of each scan for shotgun lipidomics are listed in Table 2. Raw MS data were processed using Thermo Xcalibur 3.0 and MSFileReader software (Thermo Fisher Scientific). Each lipid class was scanned at a specific mode and one continuum spectrum was acquired. At Prec184 mode specifically for PC, there were 29 continuum scans.
Using the Xcalibur 3.0 software, the 29 continuum scans of Prec184 were averaged, smoothed, and the peak intensities were determined in the centroid mode at each mass-to-charge ratio (m/z). The data list of mass-to-charge ratios and the corresponding peak intensities were copied and pasted into a Microsoft Excel sheet. Besides the Prec184, the 88 continuum scans of NL141 were also averaged, smoothed, and the peak intensities were pasted into a Microsoft Excel sheet.
Similar procedures were performed for NL277 (79 continuum scans), NL189 (130 continuum scans), Prec369 (40 continuum scans), Prec264 (196 continuum scans), and neutral loss of each fatty residue (29 continuum scans). Free fatty acids, free DHA, free EPA, and free AA, were detected by selected ion monitoring (SRM) and quantified by the corresponding isotope-labeled internal standard. A software tool developed in-house at Newomics was used to automatically average and smooth the continuum scans at each scan mode and transfer peak intensities into separate Microsoft Excel sheets. Identification of the peaks of interest and calculation of lipid species amounts were performed using consoles in Microsoft Excel. Corrections for overlap of isotopic variants were applied. The lipids in each class were quantified using the internal standards of that class, respectively. The lipids chosen as the internal standards were not present endogenously in measurable quantities in plasma samples.
Results and Discussion
1. A shotgun lipidomics platform for human plasma
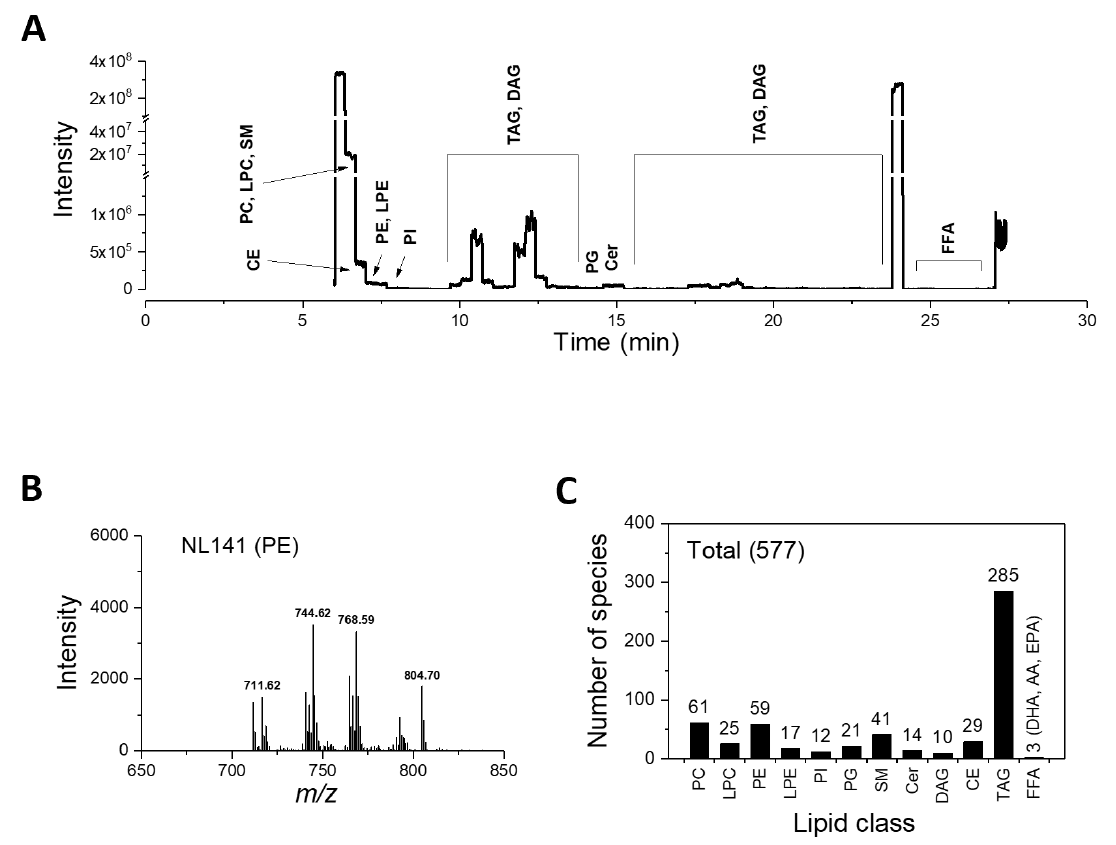
We established a shotgun lipidomics method by direct infusion ESI-MS/MS analysis of pooled plasma samples. The 12.5 µL lipid sample was continuously infused into the mass spectrometer at a flow rate of 500 nL/min (Figure 1A). During the 30-min direct infusion, the mass spectra of 12 lipid classes, including charged and neutral lipid classes, were consecutively acquired. The 12 classes of lipids were identified and quantified, including phosphatidylcholine (PC), lysophosphatidylcholine (LPC), phosphatidylethanolamine (PE), lysophosphatidylethanolamine (LPE), phosphatidylinositol (PI), phosphatidylglycerol (PG), sphingomyelin (SM), ceramide (Cer), diacylglycerol (DAG), cholesterol ester (CE), triacylglycerol (TAG), and free fatty acid (FFA).
Detailed scan parameters for each lipid class were displayed in Table 2. As a representative, neutral loss mode was applied to scan PE and the acquired spectra were shown (Figure 1B). Our shotgun lipidomics platform quantified 577 lipid species in human plasma, including 61 PC species, 25 LPC species, 59 PE species, 17 LPE Species, 12 PI species, 21 PG species, 41 SM species, 14 Ceramide species, 10 DAG species, 29 CE species, 185 TAG species, and 3 free fatty acid species (Figure 1C).
2. Sensitivity increase for lipid analysis using M3 emitters
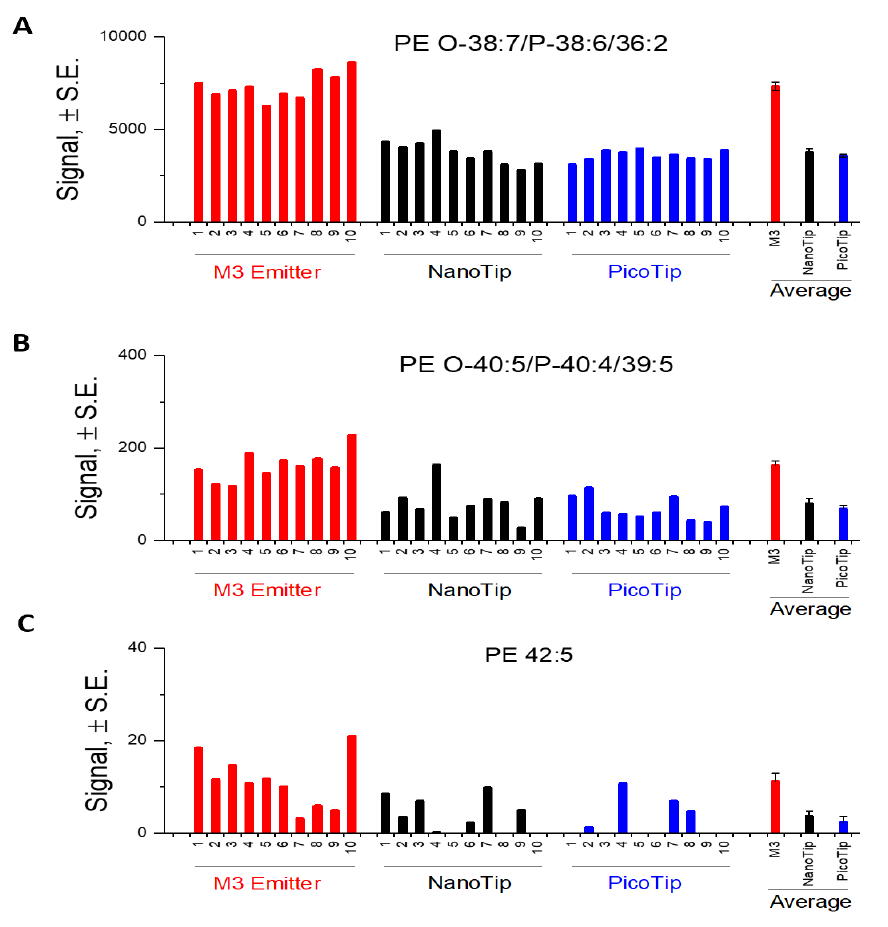
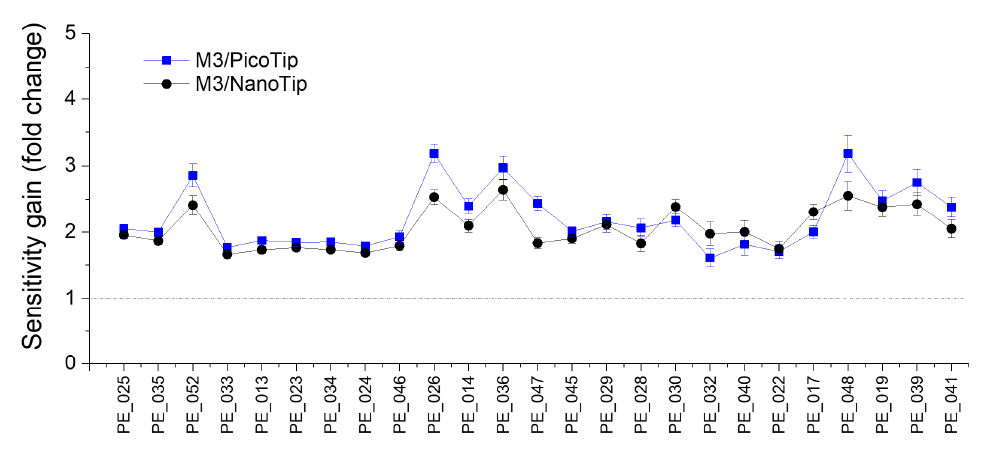
We examined the sensitivity gain of M3 multinozzle emitters over single-nozzle emitters. The identical lipid sample was infused into the mass spectrometer at the same flow rate (500 nL/min), for three different types of emitters. The M3 emitter detected significantly higher signal intensity in multiple lipid classes. As an example, Figure 2 compares signal intensity for three representative PE species (high to low abundance) in 10 consecutive runs using three types of emitters, respectively. On average, M3 emitters achieved a 2.5-fold increase in sensitivity compared to Pico- Tip, and NanoTip emitters. Among the 59 PE species, a majority of them displayed over 2-fold higher signal using the M3 emitters than those using PicoTip and NanoTip emitters, respectively. Figure 3 shows the sensitivity gain of the M3 emitter over PicoTip and NanoTip for the top 25 PE species in human plasma.
3. Improvement in reproducibility and LOD for lipid analysis using M3 emitters
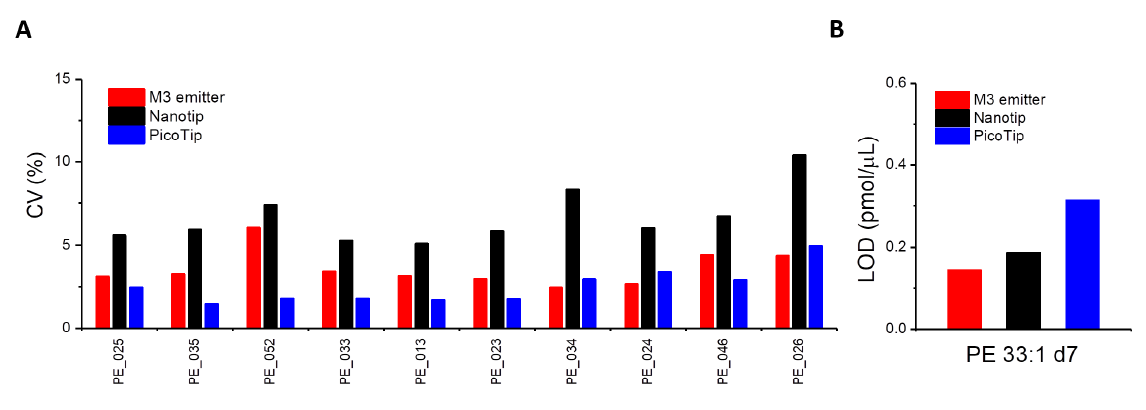
We compared the CV for 10 consecutive runs for the most abundant 10 PE species using three types of emitters (Figure 4A). On average, the M3 emitter achieved ~5% CV, comparable to those using PicoTip, while significantly outperforming those using NanoTip (~7.5% CV). We evaluated the LOD using PE 33:1 d7, an isotope-labeled internal standard. The M3 emitter displayed the lowest LOD (S/N=3) of 0.17 pmole/µL (Figure 4B), significantly outperforming both PicoTip and NanoTip. This is consistent with the higher sensitivity gained by M3 emitters (Figure 2 and 3).
Conclusions
We have established a new ESI-MS platform for shotgun lipidomics studies of human plasma samples. By interfacing to a triple Quadrupole mass spectrometer, we demonstrated that Newomics® M3 emitters could achieve high throughput, high sensitivity, and robustness for shotgun lipidomics. For most of the lipid classes in human plasma, our M3 emitters significantly outperform the conventional single-nozzle emitters in sensitivity, robustness, and LOD for their identification and quantitation using ESI-MS/MS analysis.
References
- Horn PJ, Ledbetter NN, James CN, Hoffman WD, Case CR, Verbeck GF, Chapman KD, (2010), Journal of Biological Chemistry, 286, 3298-3302.
- Holzer M, Birner-Gruenberger R, Stojakovic T, EI-Gamal D, Binder V, Wadsack C, Heinemann A, Marsche G, (2011), Journal of the American Society of Nephrology, 22, 1631-1641.
- Phelps MS, Verbeck GF, (2020), Single Cell Metabolism, 19-30.
- Savedoroudi P, Bennike TB, Kastaniegaard K, Talebpour M, Ghassempour A, Stensballe A, (2019), Journal of Proteomics, 203,
- Schilcher I, Ledinski G, Radulovic S, Hallström S, Eichmann T, Madl T, Zhang F, Leitinger G, Kolb-Lenz D, Darnhofer B, Birner-Gruenberger R, Wadsack C, Kratky D, Marsche G, Frank S, Cvirn G, (2019), Biochim Biophys Acta – Molecular and Cell Biology of Lipids, 1864(10), 1363-1374.
- Kim, Guo M., Yang P., Wang D., (2007), Analytical Chemistry, 79 (10), 3703-3707.
- Mao, Wang H.T., Yang P., Wang D., (2011), Analytical Chemistry, 83(15), 6282-6289.
- Mao, Gomez-Sjoberg R., Wang D., (2013), Analytical Chemistry, 85(2), 816-819.
- Bligh and Dyer, 1959, A rapid method of total lipid extraction and 12. Han, X.; Gross, R. W. (2001), Anal Biochem 2001, 295, 88-100.
- Li, M.; Butka, E.; Wang, X. (2014), Sci Rep 2014, 4, 6581.
- Li, M.; Baughman, E.; Roth, M. R.; Han, X.; Welti, R.; Wang, X. (2014), Plant J 2014, 77, 160-172.