Goal
To develop a new nanoflow ESI-MS platform for bottom-up proteomics that achieves high sensitivity, reproducibility, and robustness, using the Newomics® DuoESI system with MEA chips.
Introduction
Proteomics of small volumes of biological samples down to single cells has progressed rapidly. However, the sensitivity and reproducibility of ultralow flow LC-MS for proteomics remains a challenge. We developed a silicon-based, plug-and-play, nanoflow MEA chip to directly address this challenge. Our MEA chip monolithically integrates an LC column, an ESI emitter, and a post-column inlet (PCI). Employing silicon-based monolithic fabrication allows for seamless zero dead volume connections necessary for sample-limited proteomic studies. Our chip-based LC columns come with a variety of options that allow them to be used for most mainstream proteomic studies while providing a platform for novel experiments. Herein, we demonstrate that MEA chips achieve performance in small-volume bottom-up proteomics on a par with the top commercial columns while introducing novel functionalities that are not feasible with the current nanoflow LC column technologies. Our MEA chip is “more than a column”. It expands the capabilities of LC-MS and opens the door to new and exciting advancements in proteomics.
Methods
1. MEA chip platform for nanoflow LC-MS
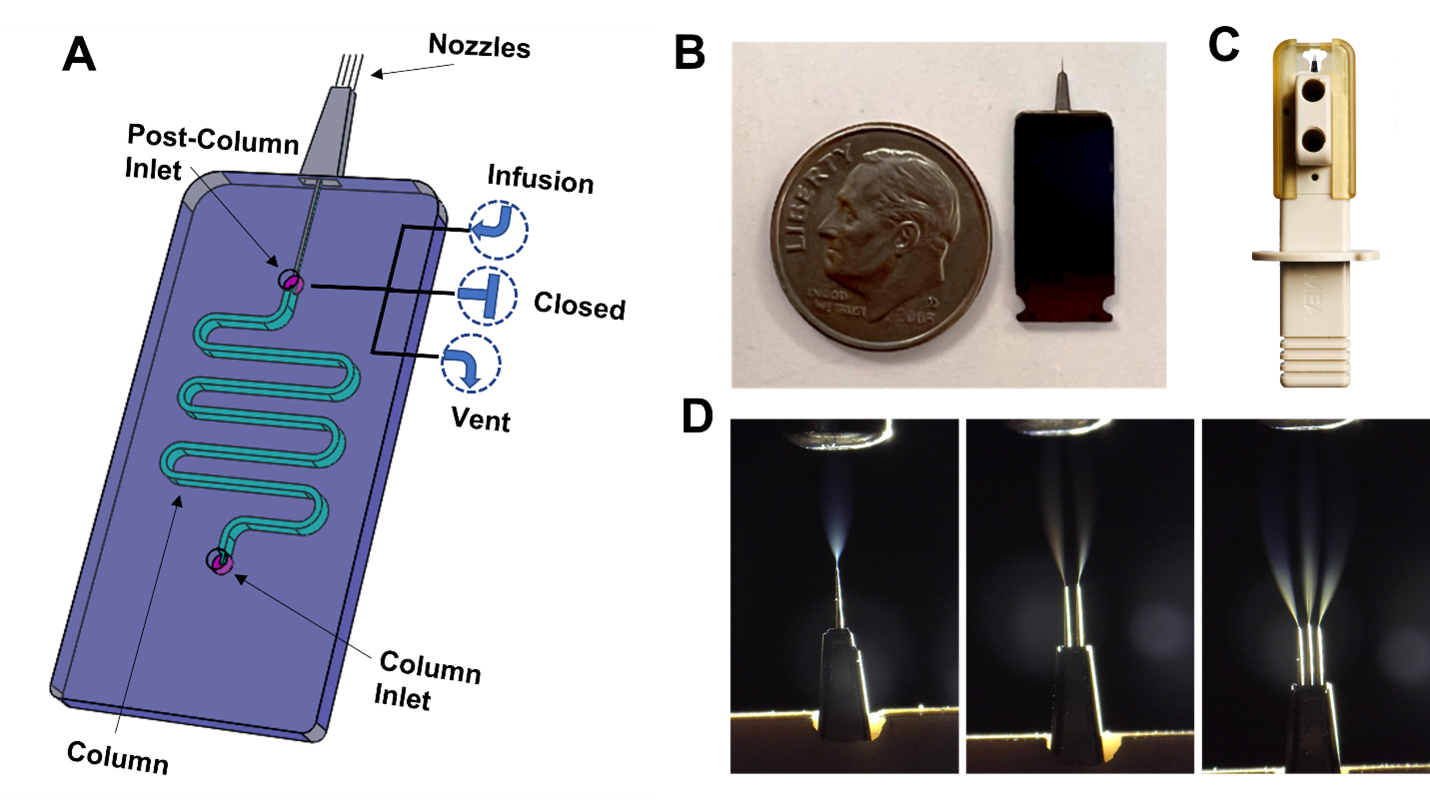
We have developed a MEA chip (Figure 1), a silicon microfluidic chip that monolithically integrates an ESI emitter, an on-chip LC column, and a post-column inlet (PCI). The MEA chip has the size of a US dime. It is packaged inside a plug-and-play cartridge for operation. For nanoflow LC-MS applications, the MEA chip incorporates a 1, 2, or 3-nozzle M3 emitter. Depending on the flow rate, the inner diameter (id) of each nozzle ranges from 2 um to 10 um.
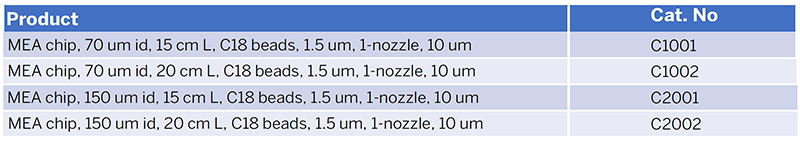
The on-chip column is 5-25 cm long with an id ranging from 50 um to 300 um. The unique design of the column allows us to pack different sizes of beads with diverse chemistry such as C18, C8, and C4. For this application, we focus on MEA chips with 70 um id, 15-20 cm long columns, and packed with 1.5 um C18 beads (Dr. Maisch) for nanoflow LC-MS.
The PCI offers several novel operating modes. For routine LC-MS runs, the PCI is closed. Infusion mode allows for post-column addition of solutions directly into the flow. It is suitable for procedures such as post-column doping, post-column reactions, and emitter washing. In the vent mode, the PCI diverts column flow from the emitter and MS to the waste during sample loading and column washing/reconditioning. This will improve the robustness and reproducibility of the column and LC-MS runs.
2. MEA chip operation
2.1 Interfacing MEA chip with a DuoESI system on a mass spectrometer
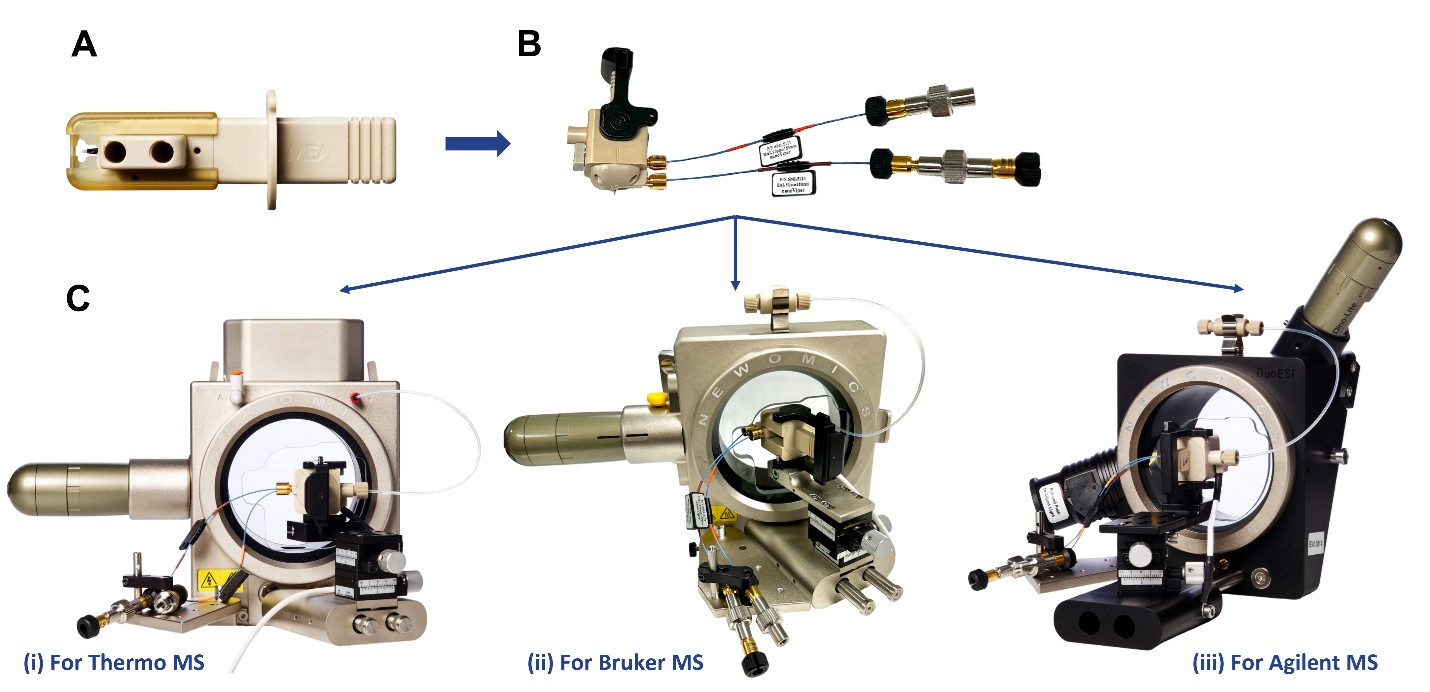
We have interfaced the MEA chips with mass spectrometers from three leading MS vendors including Thermo Fisher, Bruker, and Agilent (Figure 2). The MEA chip cartridge was inserted into the housing, which was installed on a Newomics DuoESI source mounted in the front of each mass spectrometer. One nanoViper (id 20 mm) provided the connection between the LC and the column inlet. The other nanoViper (id 50 mm) provided the connection between the PCI and the outside fluidic connections. For the three PCI modes illustrated in Figure 1, the other end of nanoViper was connected a nanoViper plug (“closed” mode), a syringe or LC pump (“infusion” mode), or a diverting valve (“vent” mode).
2.2 Nanoflow LC-MS
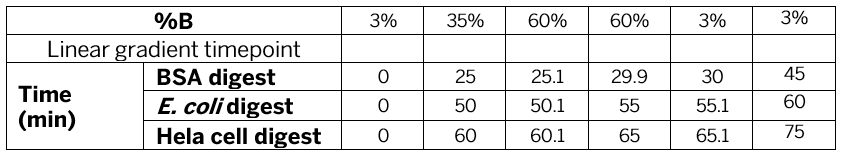
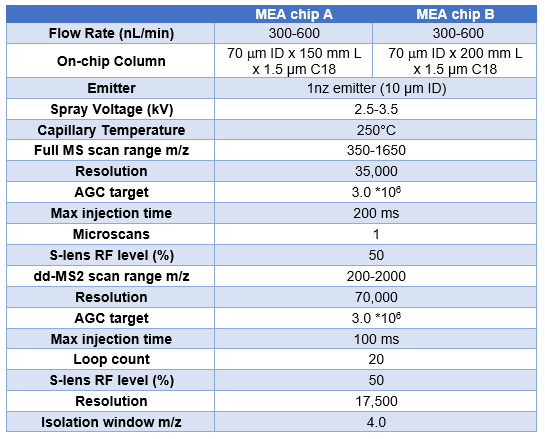
Nanoflow LC-MS analysis were performed using a Newomics DuoESI source with MEA chips, or a Nanoflex source with the commercial nanotip emitters and LC columns, interfaced to a Thermo Fisher Orbitrap Q Exactive Plus mass spectrometer or an Orbitrap Eclipse Tribrid mass spectrometer. The LC system was an UltiMate 3000 RSLC nano UPLC system (Thermo Fisher Scientific). LC gradients for different analytes are listed in Table 1 and MS parameters are listed in Table 2. For LC gradients, A buffer is 0.1% FA, 3% acetonitrile while B buffer is 0.1% FA, 97% acetonitrile. For PCI infusion, the solvent of 100% ACN or 100% methanol was infused at 100 nL/min while the on-chip LC column was run at 400 nL/min for the LC gradient.
BSA digest, E. Coli digest, and HeLa protein digest were used for method development and performance comparison across different platforms. BSA digest standard and HeLa protein digest standard were purchased from Thermo Fisher (p/n 88341, p/n 88329). E. Coli protein digest standard (MassPrep) was purchased from Waters (p/n 186003196-1). HPLC-grade water, methanol, and acetonitrile (ACN) were purchased from Sigma-Aldrich (St. Louis, MO). Formic acid (FA) was purchased from Fisher Scientific (Cat. # A117-50). Aliquoted digests stored at -20°C freezer was thawed at room temperature and serially diluted into solutions of 0.1% FA, 3% acetonitrile before LC-MS analysis.
Data were analyzed using Thermo Fisher Xcalibur software. The MS2 raw data were loaded onto SearchGUI (version 4.1.11) and searched against the Swiss-Prot human sequence DBs. For Hela digests and E.Coli digests, sequence DB used the MS-GF+ search algorithm with 10 ppm of precursor mass tolerance, and 0.02 Da of fragment mass tolerance. Max missed cleavages (2) used Carbamidomethylation of cystine (57.02) as a fixed modification. Variable modifications were Acetylation of peptide N-term (42.01), Oxidation of M (15.99), Phosphorylation of serine, tyrosine, and threonine (79.97). Proteomics search data was further analyzed by PeptideShaker (2.2.8) which established a false discovery rate (FDR) by searching decoy database and the cutoff was FDR = 0.01 (for high-confidence search) and p-value <0.05.
Results and Discussion
1. MEA chip achieves excellent performance for nanoflow LC-MS
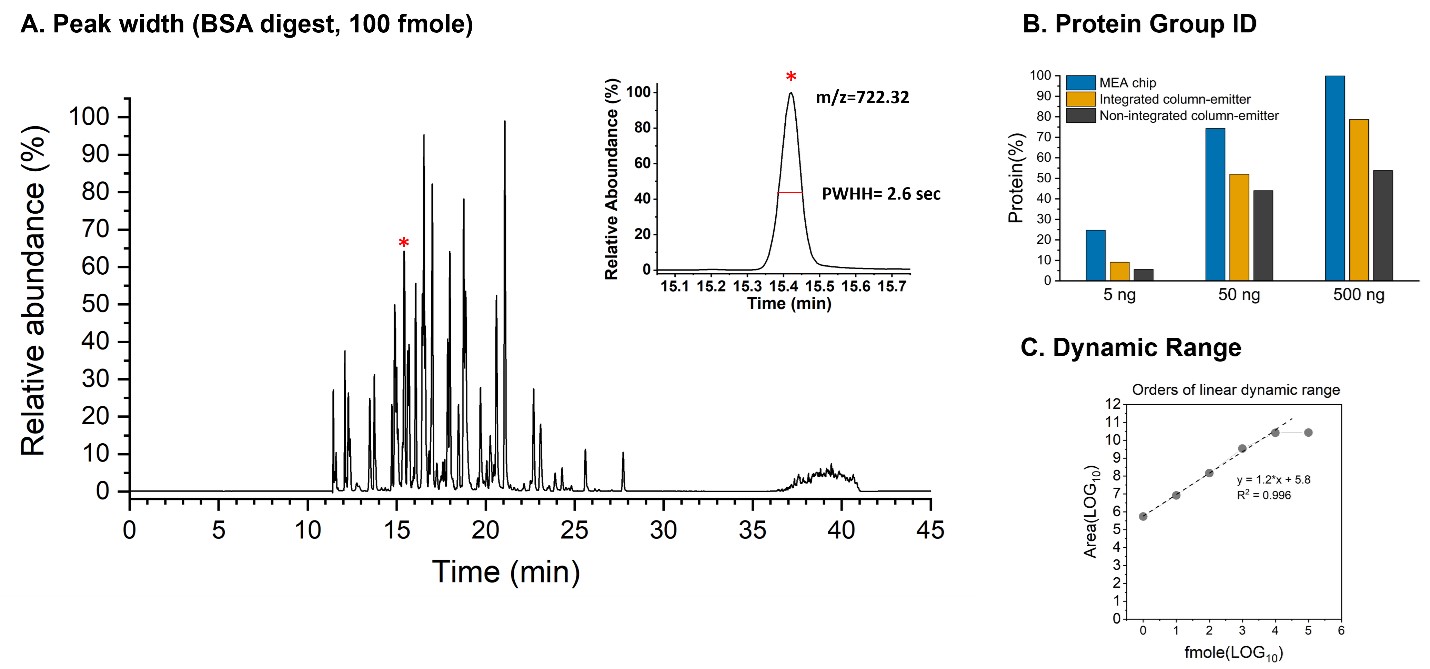
We tested the performance of a MEA chip with a 70 mm id, 20 cm long column, and packed with 1.5 mm C18 beads.
We observed on average a peak width (FWHH) of 2.6 seconds for the m/z= 722.32 peptide for the 1-hour LC-MS run of BSA digest (Figure 3a). The narrow LC peak width of the BSA digest was due, in part, to the minimum post-column dead volume.
We then benchmarked the performance of the MEA chip for protein identification and quantitation of HeLa digests. We measured the MEA chip against industry-leading column solutions for peptide proteomics across three concentrations of Hela digest. The three columns were the following: (1) MEA chip: 70 mm id x 20cm, 1.5 mm, C18 column, 10 mm emitter; (2) a commercially available integrated capillary column-emitter (75 mm id x 15 cm, 1.7 mm, C18 column, 10 mm emitter); and (3) a commercially available column with non-integrated column emitter (75 mm id x 20 cm, 1.5 mm, C18 column 10 mm emitter). Our MEA chip outperformed the integrated column-emitter and the non-integrated column-emitter across the three Hela digest concentrations, with the widest margins at the lowest concentrations of 5 ng, for the protein group ID (Figure 3b). This suggests that the sharper peak resulted from MEA chip allows for more peptide detection with an Orbitrap running DDA.
We further evaluated the dynamic range for protein quantitation. We observed the maximum four linear orders of dynamic range with the MEA chip A using the m/z= 722.32 BSA peptide and a Thermo QE+ mass spectrometer (Figure 3c).
2. MEA chip achieves high intra- and inter-chip reproducibility and a long lifetime
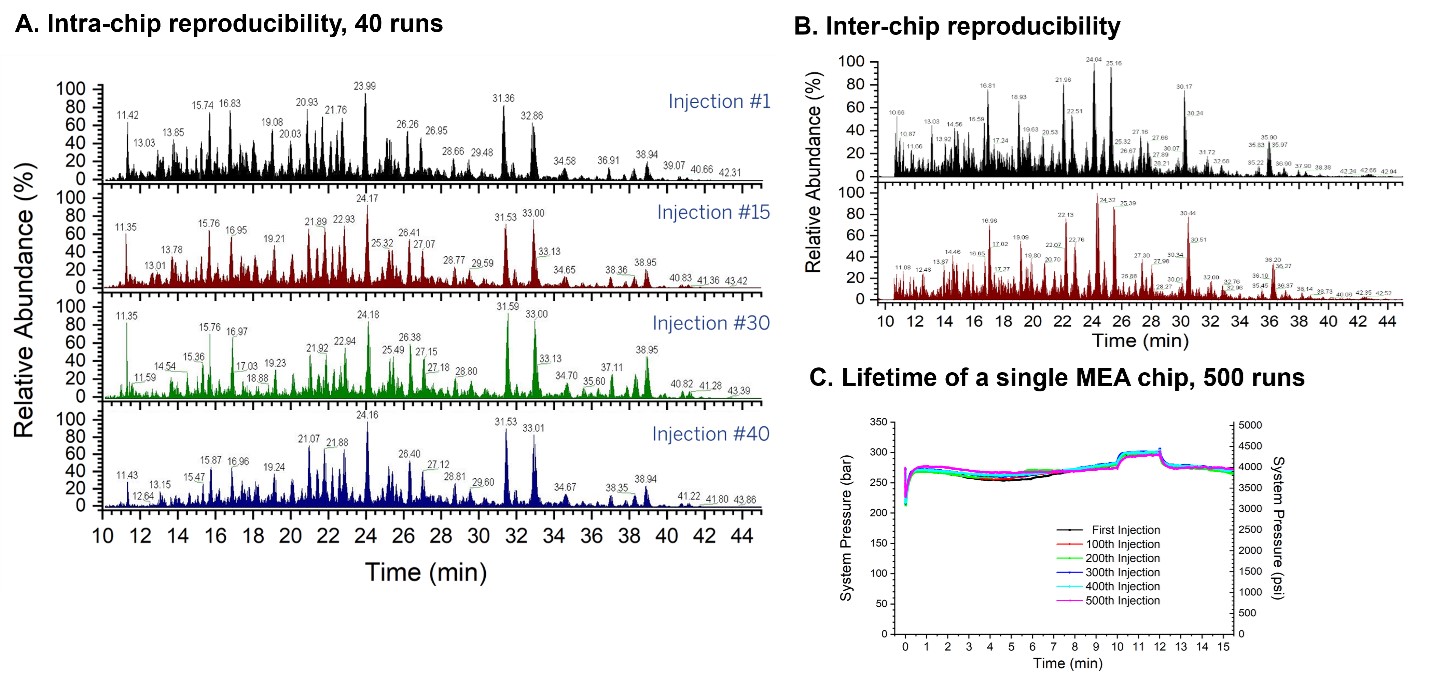
We performed 40 consecutive LC-MS runs with 200 ng E. coli digest using the MEA chip A. The average RSD for the peak retention time for 15 E. coli peptides was determined to be 0.30% (Figure 4a).
We compared the reproducibility between two identical MEA chip B by comparing Hela cell digest LCMS runs. Protein counts for each LCMS run did not vary more than 3% between the two chips (Figure 4b).
Finally, we performed 500+ consecutive LCMS runs using HeLa digests while monitoring the pressure. The MEA chip A showed very little pressure variations across the 500 LCMS runs (Figure 4c).
These results demonstrated that our MEA chip has excellent and highly competitive intra- and inter-chip reproducibility and a lifetime of at least 500 consecutive injections.
3. MEA chip achieves performance for bottom-up proteomics on a par with commercial columns
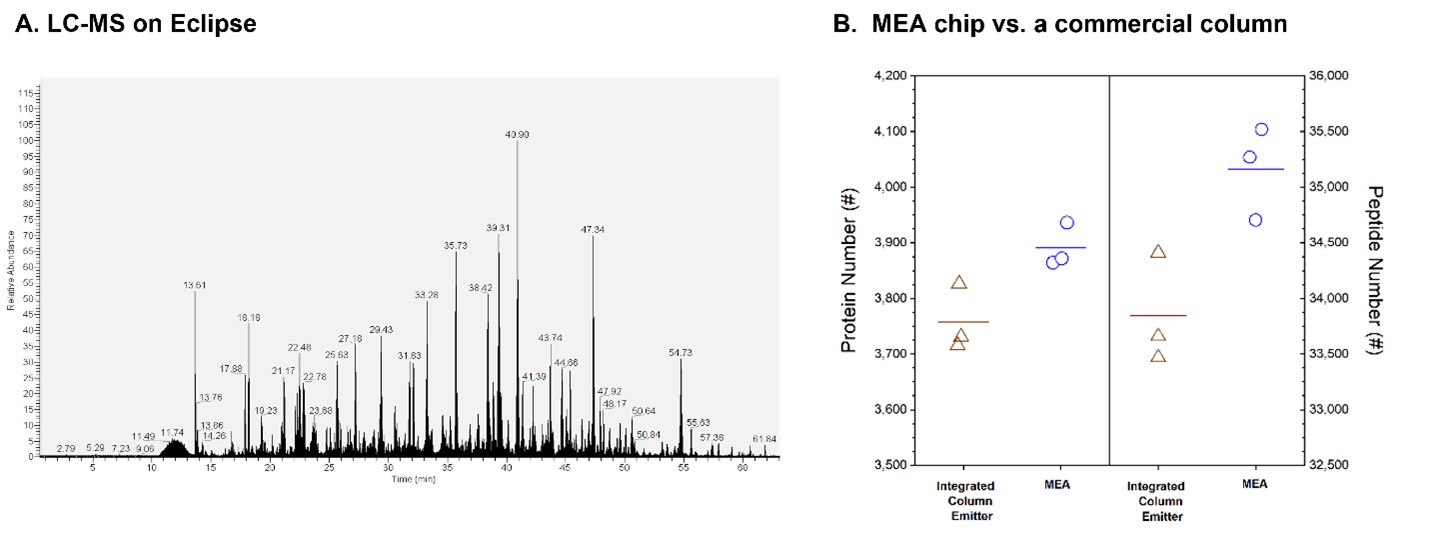
To further validate our MEA chips bottom-up proteomics, we performed LC-MS analysis of HeLa digests using an Orbitrap Eclipse Tribrid mass spectrometer. As shown in Figure 5a, we obtained an excellent LC-MS chromatograph for 100 ng HeLa digest in a 1-hour LC-MS run at the flow rate of 600 nL/min.
We then compared in triplicate runs our MEA chip (70 mm id X 20 cm X 1.5 mm C18 beads X 1nz, 10 mm emitter) with a commercially available integrated capillary column-emitter (75 mm id x 20 cm x 1.7 mm C18 beads x 6 mm emitter). Both platforms identified approximately 35,000 peptide groups and 3,800 protein groups, with MEA chip obtaining slightly higher ID numbers (Figure 5b).
4. MEA chip is more than a column
Since PCI on MEA chip provides the opportunities to implement novel functions including doping and venting of the waste, we tested the feasibility of using its various modes to improve the sensitivity and robustness of nanoflow LC-MS.
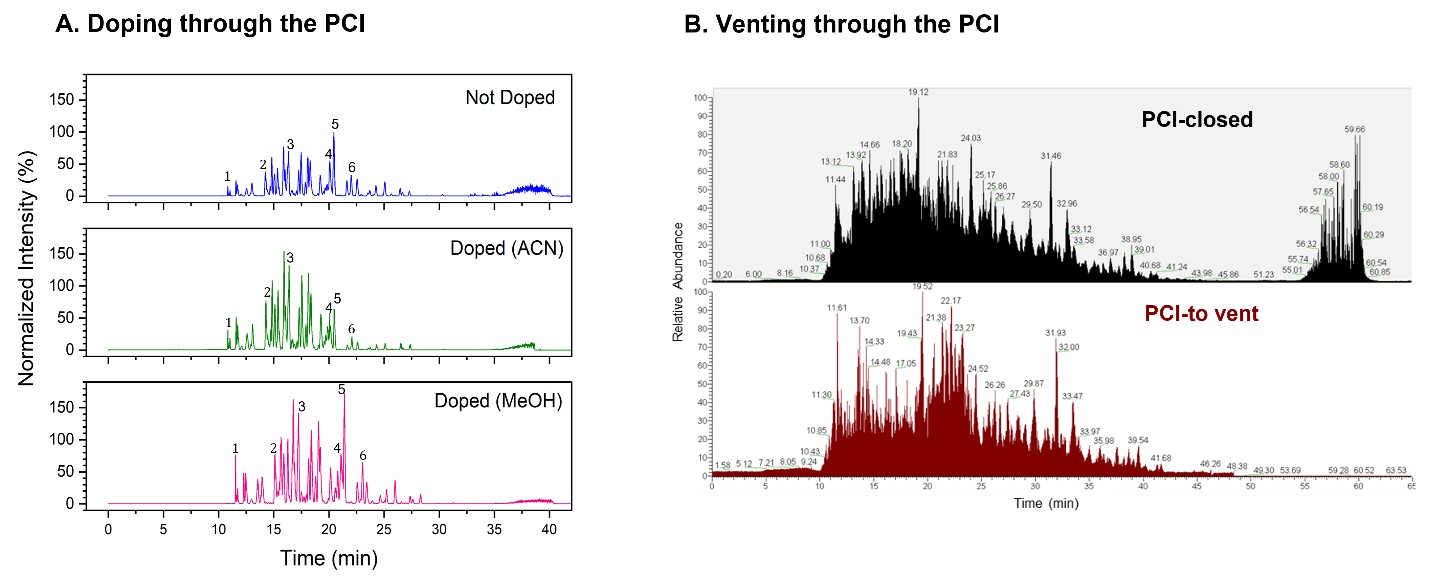
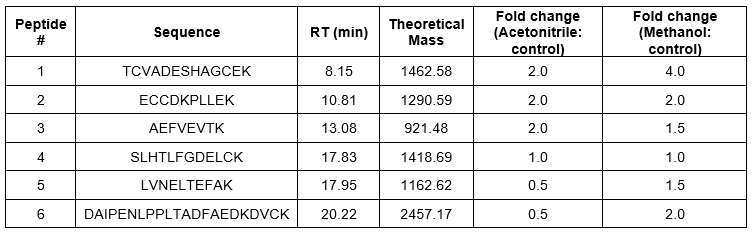
For the infusion mode, we infused 100% ACN or methanol at 100 nL/min, while the main LC column was running the LC gradient at 400 nL/min for BSA digest. As shown in Figure 6a, and quantified for 6 peptides in Table 3, even though the infusion of organic solvent had some dilution effect (20%), we did not note a change in peak width. The majority of the hydrophilic peaks had significantly higher intensity for organic doping. For example, a representative hydrophilic peptide #1 with a m/z=488.54 had an intensity of 2.0-fold for doping with ACN, and strikingly, 4.0-fold for doping with methanol, compared to the control (closed mode). Importantly, doping with methanol resulted in higher intensity increase compared to ACN for this peptide, suggesting better ionization efficiency for methanol than ACN. As a matter of fact, five out of the six peptides had higher sensitivity with methanol doping compared to the control. Acetonitrile is a preferred solvent in reverse phase separation for a C18 column. Our results suggest a possibility of combining ACN as the separation solvent, and methanol as the ionization solvent, for reverse phase LC-MS to produce the best separation efficiency and highest mass spectrometry sensitivity.
For the vent mode, we used the PCI to divert the wash eluent away from the ESI emitter. As shown in Figure 6b for a typical LC-MS run of BSA digest, the wash eluent during the column washing and conditioning step in the high organic gradient was diverted to waste. This prolongs the lifetime of the emitter by reducing clogging while reducing column washing waste from contaminating the mass spectrometer. This novel function greatly improves the robustness of LC-MS for bottom-up proteomics.
Conclusion
- Newomics has developed the MEA chip for LC-MS that achieves high sensitivity and high reproducibility for bottom-up proteomics.
- Our DuoESI platform with MEA chips is a plug-and-play system, and it interfaces with mass spectrometers from three leading MS vendors including Thermo Fisher, Bruker, and Agilent for diverse applications.
- Newomics MEA chip is more than a column. The novel operational modes through PCI including doping, washing, venting, and more, could significantly improve the sensitivity, reproducibility, and robustness of LC-MS, thereby enabling its wider adoption for biopharmaceutical and clinical diagnostic applications.
Reference
- Kim, W., M. Guo, P. Yang, and D. Wang, Microfabricated monolithic multinozzle emitters for nanoelectrospray mass spectrometry. Anal Chem, 2007. 79(10): p. 3703-7.
- Mao, P., H.T. Wang, P. Yang, and D. Wang, Multinozzle emitter arrays for nanoelectrospray mass spectrometry. Anal Chem, 2011. 83(15): p. 6082-9.
- Mao, P., R. Gomez-Sjoberg, and D. Wang, Multinozzle emitter array chips for small-volume proteomics. Anal Chem, 2013. 85(2): p. 816-9.
- Mao, P. and D. Wang, Top-Down Proteomics of a Drop of Blood for Diabetes Monitoring. J Proteome Res, 2014. 13(3): p. 1560-9.
- Mao, P. and D. Wang, Biomonitoring of perfluorinated compounds in a drop of blood. Environ Sci Technol, 2015. 49(11): p. 6808-14.
- Chen, Y., P. Mao, and D. Wang, Quantitation of Intact Proteins in Human Plasma Using Top-Down Parallel Reaction Monitoring-MS. Anal Chem, 2018. 90(18): p. 10650-10653.
- Wang, D. and S. Bodovitz, Single-cell analysis: the new frontier in ‘omics’. Trends Biotechnol, 2010. 28(6): p. 281-90.
- ASMS 2022 Poster THP099: NanoMEA Chip Platform for Proteomics
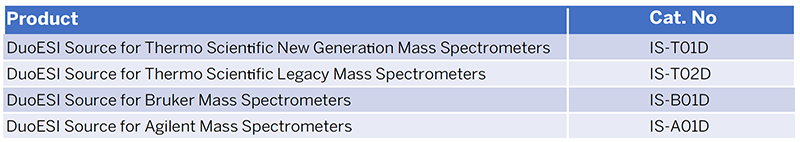
Ordering Information
Ion Sources
Consumables