Goal
To establish a Microflow-nanospray ESI-MS (MnESI-MS) platform for LC-native MS analysis of labile native protein complexes, that achieves high throughput, high sensitivity, and robustness, using the Newomics® MnESI source and M3 multinozzle emitters interfaced with the Thermo Scientic™ Q Exactive™ UHMR Hybrid Quadrupole-Orbitrap™ Mass Spectrometer.
Introduction
Native mass spectrometry (MS) maintains a biomolecule’s natural folded state and associated non-covalent interactions for mass spectrometry analysis and is a powerful technique for studying the structure of intact proteins, large protein complexes, and protein-protein, protein-ligand interactions [1-4]. Currently, one of the biggest challenges for native MS is the analysis of large native protein complexes and their mixtures in a high-throughput manner. The current static nanoelectrospray MS (nanoESI-MS) method requires a delicate technique for sample introduction and a lengthy buffer exchange process for sample preparation, suffers from low reproducibility and robustness, and has a low sample throughput [5-8].
On the other hand, the conventional analytical flow LC-MS method has not been adopted widely for native MS studies of large bioorganic complexes because it does not have the sensitivity of static nanoESI-MS or may not be able to maintain the native state of labile protein complexes during mass spectrometry analysis. To directly address the challenges, we have developed a new Microflow-nanospray ESI-native MS (MnESI-MS) platform with a MnESI source and M3 emitters interfaced with the Q Exactive UHMR mass spectrometer, to achieve high-sensitivity and high-throughput LC-MS analysis of bioorganic complexes while maintaining their native state [9-12]. We have validated our platform using GroEL, r20S, and t20S proteasome as model complexes and demonstrated its utilities for cryo-EM sample screening.
Methods
1. Sample preparation
E.coli GroEL was purchased from Sigma (Cat. #: C7688) and prepared for analysis with a working concentration of 1.2 µM in 100 mM ammonium acetate as described [13]. 20S proteasome complexes from Thermoplasma acidophilium (t20S) and rabbit (r20S proteasome) were obtained from Dr. Fabian Hennenberg (MaxPlank Institute, Gottingen), and prepared for native MS analysis in different biological buffers. For static nanoESI-MS experiments, samples were buffer exchanged to aqueous ammonium acetate buffer (100 mM, pH 7.0) with several concentration/ dilution rounds using Amicon Centrifugal concentrators (Millipore-Sigma 30 kDa MWCO, 10,000 x g, 4 °C). After buffer exchange, the stock solution was diluted to a final concentration of approximately 1-1.2 µM.
2. Static Nanoelectrospray Native MS analysis
The purified protein samples after buffer exchange were loaded into a Thermo Scientific™ borosilicate emitter (ES 387) for nano-ESI. Samples were analyzed on a Q Exactive-UHMR instrument using Tune 2.11. Instrument parameters were set for the detection of large protein complexes using the default tune method for GroEL. For proteasome analysis, S-lens were set to 0, spray voltage to 1.2-1.4 kV, and capillary temperature to 275 °C.
3. SEC-LC/MS analysis
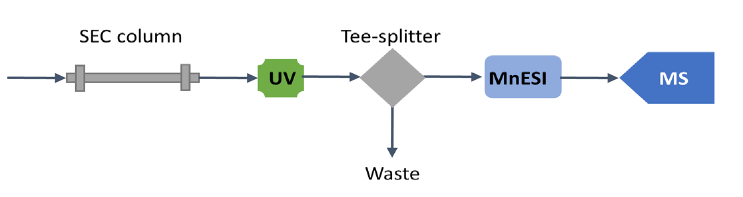
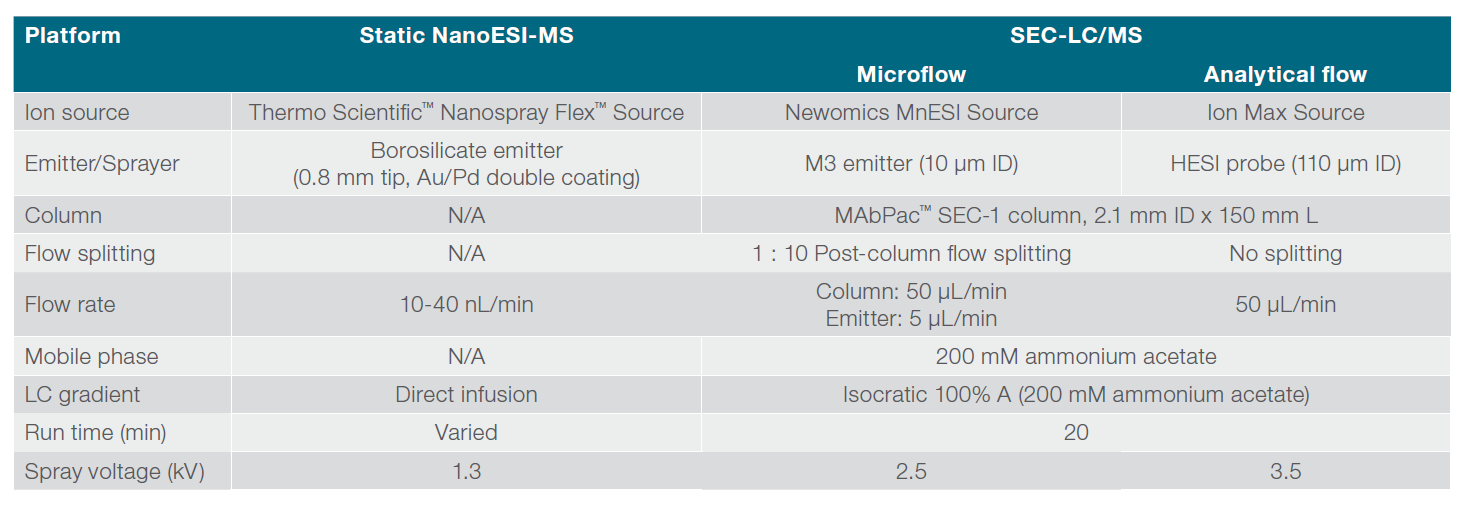
The size exclusion chromatographic separation was performed on a Thermo Scientific™ MAbPac™ SEC-1 column (2.1 mm ID x 150 mm L, Cat. #: 088790) using a Thermo Scientific™ Vanquish™ Flex UHPLC system at a flow rate of 50 µL/min. Native proteins were detected by UV (280 nm) after chromatographic separation and mass spectra were acquired on a Q Exactive UHMR mass spectrometer using full scan (MS1) mode and instrument parameters the same as for nanospray using spray voltages 2.5-3.5 kV and capillary temperature of 275-320 °C. S-lens were set to 0 for proteasome analysis. Both microflow SEC-LC/MS and analytical flow SEC-LC/ MS methods were employed for analysis of native proteins and their performances were compared. For microflow SEC-LC/MS, the analytical flow was split at 1:10 ratio post-column via a stainless-steel Tee connector, before it was introduced to a Newomics MnESI source at 5 µL/min and sprayed via an M3 multinozzle emitter (Figure 1). For analytical flow SEC-LC/MS, no post-column splitting was performed. The native protein analytes were introduced to a Thermo Scientific™ Ion Max Source with a Thermo Scientific™ HESI probe at 50 µL/min. The SEC-LC/MS conditions for microflow using the MnESI source and analytical flow using the HESI source are summarized in Table 1.
4. Cryo-electron microscopy (Cryo-EM)
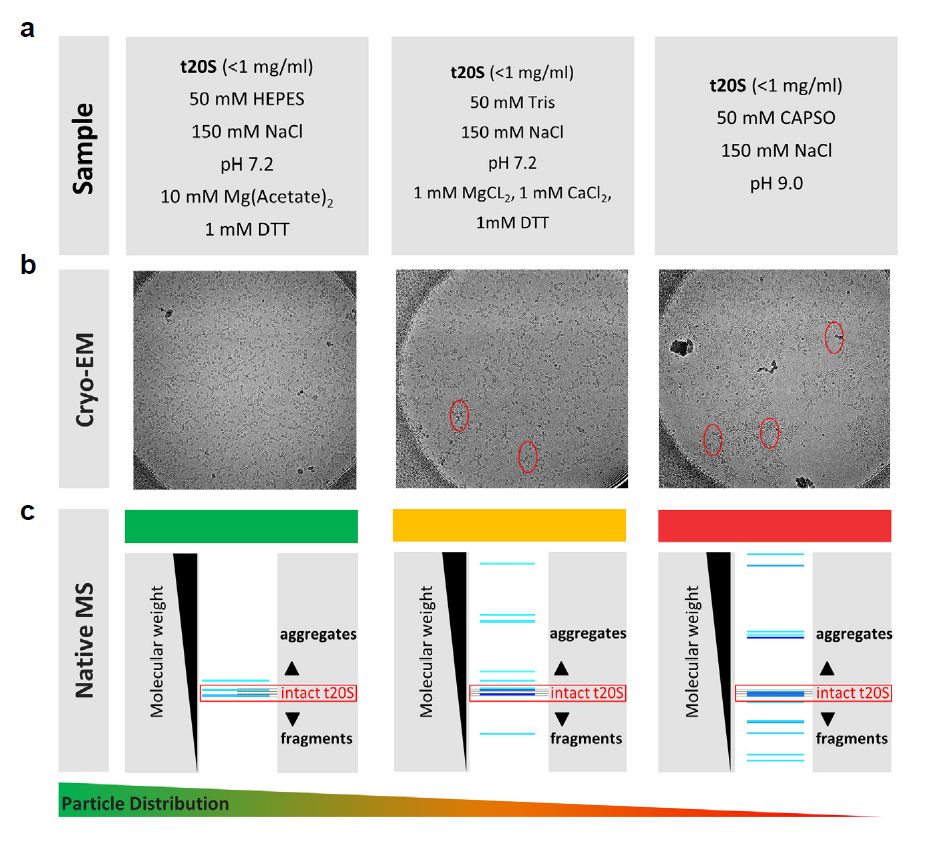
A total of 3 µl of t20S sample in different buffer conditions as shown in Figure 5 was applied onto glow-discharged R1.2/1.3 300 mesh holey carbon EM grids (Quantifoil), then blotted for 5.5 seconds with 0 blot force before plunge-freezing the grids into liquid ethane cooled by liquid nitrogen. Plunge-freezing was performed using a Thermo Scientific™ Vitrobot™ Mark IV at 100% humidity and 4 °C conditions. Single particles data were collected on a Thermo Scientific™ Glacios™ Cryo Transmission Electron Microscope with a Thermo Scientific™ Falcon™ 3 Direct Electron Detector at a magnification of 73K.
5. Data processing
Data were analyzed using Thermo Scientific™ Xcalibur™ software and Thermo Scientific™ Biopharma Finder™ 4.0 software. Native MS spectra were deconvoluted using the ReSpect algorithm and the Sliding Window method. The most abundant ion from the mass spectrum of the protein analyte was used for signal-to-noise (S/N) calculation in the Xcalibur Software Qual Browser.
Results and discussion
1. MnESI platform for LC-MS analysis of native protein complexes
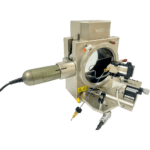
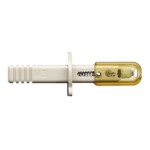
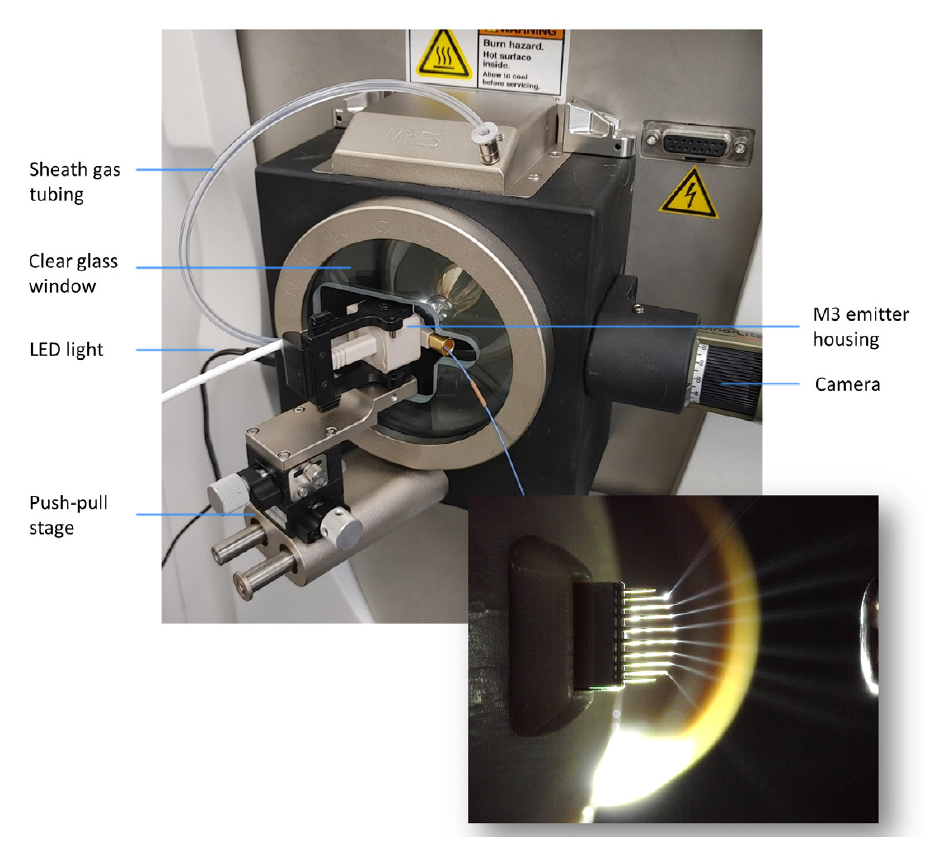
The MnESI platform (Figure 2) integrates the new MnESI source with the award-winning multinozzle emitter (M3 Emitter) for electrospray ionization. The M3 emitter splits incoming microflow LC eluent evenly to multiple nanoflows, thereby significantly enhancing ionization efficiency and reducing matrix effects to achieve improved sensitivity and robustness in LC-MS analysis. The MnESI source significantly improves user experience by enabling plug-and-play emitter operation. The M3 emitter is mounted on a push-pull stage for easy set-up and maintenance. A high precision translation stage provides fine adjustment of the emitter position relative to the MS inlet. The MnESI source is equipped with a high-quality imaging system to allow clear visualization of the electrospray process. It is designed in a closed format to ensure operation safety and hygiene. The clear glass window in the front allows for convenient observation of the electrospray during the tuning process. The fixed spray angle with one axis fine adjustment delivers reproducible performance. Notably, only one connection with Thermo Scientific™ nanoViper™ tubing or a VICI adapter is needed to complete the plumbing to different LC columns. The MnESI source comes with two versions for NG and Legacy interfaces, respectively, making it fully compatible with all Thermo Scientific™ mass spectrometers.
2. MnESI platform increases sensitivity for SEC-LC/MS analysis of native GroEL protein complex, and delivers the same data quality as static Nanospray ESI-MS
The GroEL protein complex is a molecular chaperone with a molecular weight of approximately 801 kDa [14] (14-mer, 57 kDa each). It is a fully active tetradecamer complex that is required for the proper folding of many proteins in cells and common model protein to tune and optimize a mass spectrometer for native MS analysis. We performed the 3-way comparison, microflow LC-MS after 1:10 splitting from analytical flow, analytical flow LC-MS, and static NanoESI-MS. Analytical scale SEC columns (e.g., 2.1 mm ID) are preferred over capillary scale columns due to their advantages in throughput and robustness in analyzing complex samples [15]. Herein a post-column splitting strategy was employed to integrate an analytical column with the MnESI source for microflow SEC-LC/MS analysis of large protein complexes.
As illustrated by the total ion chromatogram (TIC) of the GroEL 14-mer (Figure 3a), GroEL was eluted as a single peak with a 14-mer peak and its monomer peak was not observed. A similar charge envelope of the native GroEL 14- mer complex was observed using the MnESI source with M3 multinozzle emitters at microflow of 5 µL/min (Figure 3b), compared to the charge state envelopes using the HESI source with single nozzle emitters at an analytical flow of 50 µL/min (Figure 3c), as well as using the Nanospray Flex source with single nozzle emitters at static nanoflow of <40 nL/min (Figure 3d). Mass spectra from microflow LC/MS analysis using MnESI, analytical flow LC/MS using HESI, and static NanoESI-MS all contained well-resolved, native charge states and the measured mass corresponded well with the expected mass for the GroEL 14-mer complex of 801 kDa [14].
MnESI platform at microflow delivered increased signal intensity and reduced chemical noise compared to the HESI analytical flow method. More specifically, the signal intensity of the most abundant peak achieved by the MnESI platform was 4.8-fold higher than that from the HESI method, and the signal-to-noise ratio (S/N) for the most abundant peak by MnESI was over 11-fold higher than that of the HESI probe method (Figure 3e). It is important to note that the MnESI-MS platform at microflow employed a 1:10 post-column flow splitting, which means the sample amount injected for MS detection was 10 times less than the sample amount used in the HESI probe analytical flow method. Considering the amount of protein sample injected into the mass spectrometer, the MnESI platform demonstrated a significant gain of approximately 50-fold in sensitivity compared to the conventional HESI probe analytical flow method. With the sensitivity improvement from the MnESI platform, it is possible to analyze samples with a smaller amount or shorter gradient. Furthermore, reduction of high salt and protein complexes injection into the mass spectrometer minimizes the contamination to the instrument, enhances method robustness, and reduces the downtime due to cleaning.
Compared to the conventional static NanoESI-MS technique (Figure 3d), MnESI platform at microflow (Figure 3b) delivered similar sensitivity and data quality but without the lengthy offline buffer exchange. The static NanoESI-MS method attains high sensitivity for protein analysis with the lowest sample consumption, however, the method is manual and lab-intensive, and robustness and throughput are not ideal. It requires the operator’s close supervision. The MnESI platform enables microflow LC/MS with static nanoflow sensitivity in an automated high-throughput fashion. It also provides LC separation that could not be achieved by static nanoESI-MS. As shown in Figure 3b, we were able to detect the minor 15-mer GroEL complex (< 5%) as our preparation produced the active form of GroEL. The online LC separation before MS is critical in analyzing labile protein complexes in a mixture because the lengthy offline purification process could result in the disruption of native protein complexes. With an LC run time of less than 20 min, the MnESI platform has a potential for higher sample throughput and assay robustness in analyzing native intact proteins and protein complexes, while maintaining the sensitivity and data quality.
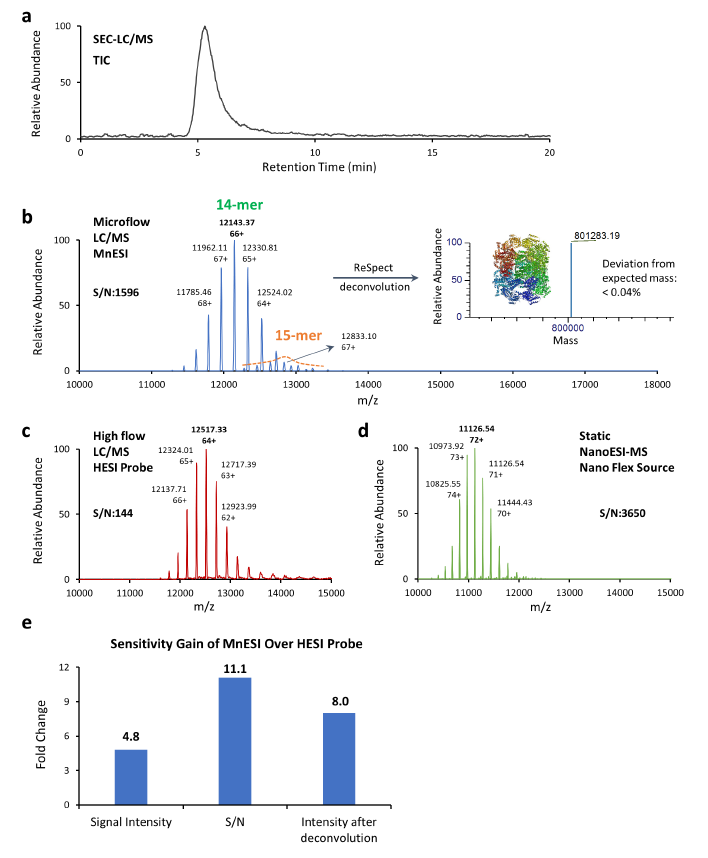
c. Native MS1 analysis of GroEL 14-mer using the Ion Max source with HESI probe at an analytical flow of 50 μL/min. d. Native MS1 analysis of GroEL 14-mer (1.25 μM) using static NanoESI-MS. e. Sensitivity comparison of MnESI platform vs. HESI probe method.
3. MnESI platform enables Native LC-MS analysis of large labile protein complexes
The mammalian 20S proteasome complex consists of four stacked rings composed of alpha/beta/beta/alpha subunits. There are seven different alpha non-catalytic subunits and seven different beta subunits from which three have catalytic activity (Figure 4e). Rabbit 20S (r20S) proteasome is considered to be one of the most labile proteasome complexes [16] and it requires the softest mass spectrometric conditions even for analysis using static nanoESI-MS, including setting S-lens to 0 (Figure 4e).
For microflow SEC-LC/MS analysis of r20S proteasome using the MnESI platform, different S-lens settings were evaluated to optimize mass spectrometric conditions. The UV chromatograms acquired at the S-lens setting of 200 (Figure 4a), the default settings for the GroEL tune method, and the S-lens setting of 0 (Figure 4b) were identical. However, all seven alpha subunits ejected from the r20S proteasome complex were observed in spectra acquired at the S-lens setting of 200 (Figure 4c), but not at S-lens settings of 0 (Figure 4d). This indicates that the r20S proteasome is a very labile protein complex and challenging for native MS analysis. It requires precise fine-tuning of mass spectrometric conditions for detection of the intact protein 28-subunit complex.
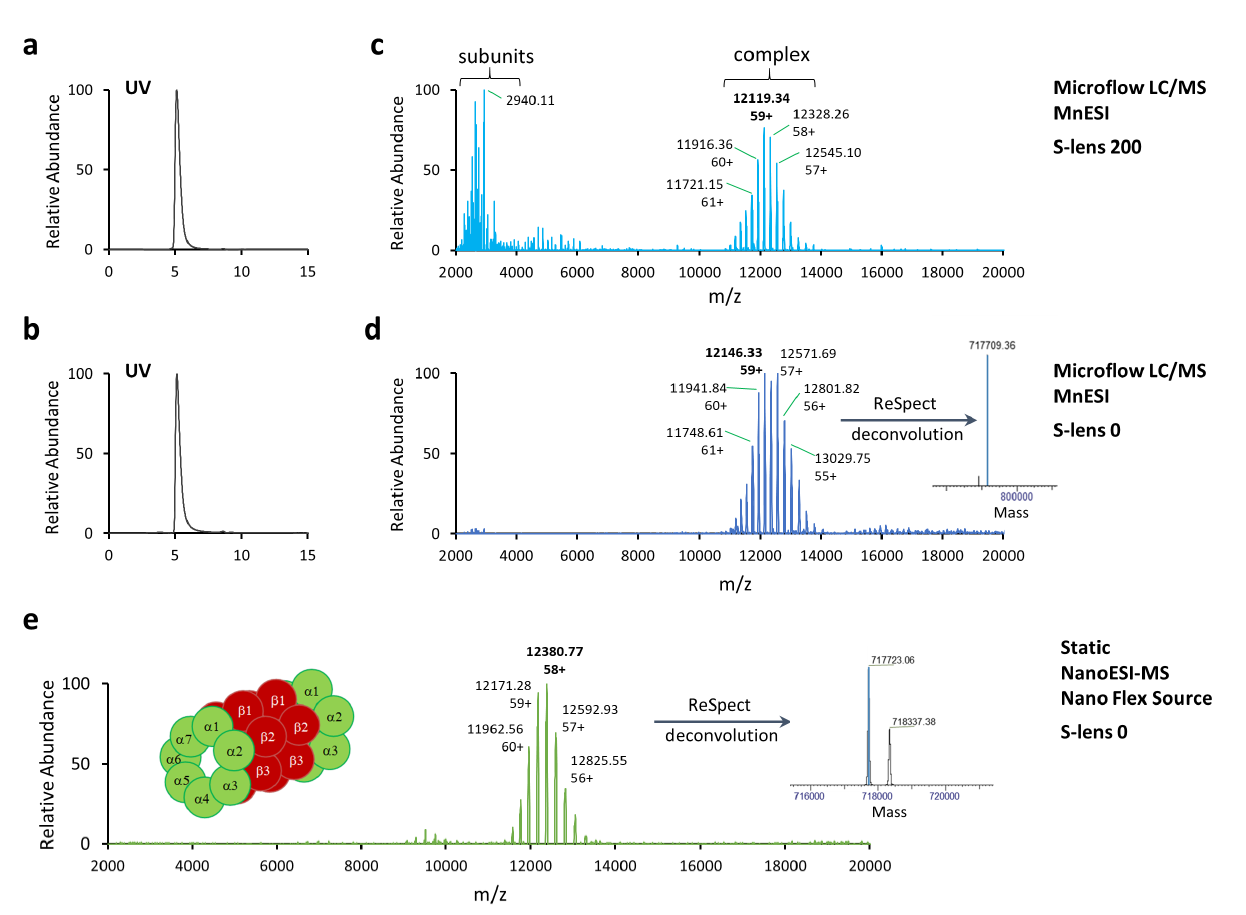
The native charge envelope for this r20S proteasome complex was produced in the MS1 level using the MnESI platform at microflow of 5 µL/min and optimized mass spectrometric conditions (Figure 4d). The MnESI data was comparable to the charge profile from the conventional static nanoESI-MS method (Figure 4e). After charge deconvolution, a measured molecular mass of 717.7 kDa was obtained with a deviation from the expected mass of less than 0.2% [16]. MnESI platform achieved comparable sensitivity and MS1 data as the static nanoESI-MS method for analysis of the r20S proteasome complex. However, microflow SEC-LC/MS enabled by the MnESI platform allows for much higher sample throughput for native protein analysis. It is noteworthy that using a standard LC-HESI probe-native MS setup with the optimized tune file (S-lenses settings of 0) we were able to only detect dissociated 20s proteasome complex but not the full complex (data not shown).
The “softer” spray conditions (with low spray voltage and without the use of a sheath or auxiliary gases) and higher sensitivity provided by our MnESI platform greatly facilitate native mass spectrometry analysis of large labile protein complexes, such as the r20S proteasome in this study. In order to preserve the native state of labile protein complexes and achieve high sensitivity, it’s important to use a low spray voltage (e.g., 2,500V) and reduce electrospray current, especially when very high ionic strength buffer like 200 mM ammonium acetate is used. Longer tubing between the splitter and the emitter helps reduce spray current but may introduce more post-column dead volume and thus result in border peak and lower sensitivity. Therefore, shorter tubing is recommended in this application. An effective way to reduce spray current is to avoid any conductive component/part (e.g., metal splitter) between the sample injection valve and the emitter from touching any metal (grounding) surface. Basically, the ground should be kept furthest away from the emitter. Caution should be taken to avoid any electrical shock during operation.
4. MnESI platform facilitates high-throughput sample screening for Cryo-EM
Understanding the quality of a cryo-EM sample prior to microscopy is a critical step in achieving a high-resolution image. As the biological systems addressed by cryo-EM are getting more complex, so are the range of buffer conditions and sample requirements, which need to be explored to arrive at a stable, homogeneous protein or protein complex that are randomly distributed in vitreous ice. At the same time, solely testing the sample’s stability and homogeneity will not be enough, as protein complexes purified directly from cells will have post-translational modifications, truncations, and even other endogenous proteins binding to them, which can all be critical for their structures and ultimately their functions. This requires a much faster and more thorough characterization of the biological system than the currently available standard techniques including size-exclusion chromatography, Western blotting, SDS-PAGE, and negative stain imaging. Recently, native mass spectrometry emerged as a new technique to provide a solution to meet the new requirements for cryo-EM sample screening, while significantly speeding up the sample preparation workflow [17]. The microflow SEC-LC native MS method powered by our MnESI platform enables high throughput sample screening as shown in Figure 5, with a high correlation with cryo-EM. The model protein complex, 20S proteasome complex from Thermoplasma acidophilium (t20S) [18], was prepared for the analysis in different biological buffers to find the optimal conditions for cryo-EM analysis. MS and LC conditions optimized for rabbit proteasome complex were employed. In our correlative study, HEPES buffer was found to provide the best result in cryo-EM as assessed from the critical attributes of sample stability, sample homogeneity (including aggregation analysis), and particle density and distribution. In contrast, significant aggregation, as well as some complex dissociation, was detected in the CAPSO buffer by both techniques, consistent with the fact that the higher pH was problematic for t20S sample stability. These results clearly demonstrate the utility of native LC/MS using the MnESI-MS platform for cryo-EM sample screening and optimization of buffer conditions for detailed cryo-EM structural studies. For this type of analysis, separation is required to estimate the number of different species and static nanoESI-MS experiments will not be able to provide similar results because of the ion suppression of less abundant species by the more abundant species.
Conclusion
The Newomics Microflow-nanospray ESI (MnESI) platform seamlessly interfaces microflow LC with nanospray ESI-MS for native LC-MS studies of intact proteins and labile protein complexes with increased sensitivity and robustness. The microflow SEC-LC/MS method empowered by the new MnESI platform achieves comparable data quality as the conventional static nanoESI-MS assays and allows for automated analysis, higher sample throughput, and higher reproducibility and robustness. In addition, the MnESI platform at microflow delivers enhanced signal and reduced chemical noise compared to the analytical flow method using a HESI source, which enables sensitive detection of large labile protein complexes. The utility of MnESI platform has been successfully demonstrated for screening of cryo-EM samples in a high-throughput fashion.
References
- Gil, , et al., Proteoform-Specific Protein Binding of Small Molecules in Complex Matrices. ACS Chem Biol, 2017. 12(2): p. 389-397.
- Ishii, , M. Zhou, and S. Uchiyama, Native mass spectrometry for understanding dynamic protein complex. Biochim Biophys Acta Gen Subj, 2018. 1862(2): p. 275-286.
- Leney, C. and A.J.R. Heck, Native Mass Spectrometry: What is in the Name? J Am Soc Mass Spectrom, 2017. 28(1): p. 5-13.
- Zheng, , et al., Protein dynamics and conformational changes explored by hydrogen/ deuterium exchange mass spectrometry. Curr Opin Struct Biol, 2019. 58: p. 305-313.
- Schachner, F., et al., Standard Proteoforms and Their Complexes for Native Mass Spectrometry. J Am Soc Mass Spectrom, 2019. 30(7): p. 1190-1198.
- Heck, J. and R.H. Van Den Heuvel, Investigation of intact protein complexes by mass spectrometry. Mass Spectrom Rev, 2004. 23(5): p. 368-89.
- Barth, and C. Schmidt, Native mass spectrometry-A valuable tool in structural biology. J Mass Spectrom, 2020. 55(10): p. e4578.
- Gault, , et al., Combining native and ‘omics’ mass spectrometry to identify endogenous ligands bound to membrane proteins. Nat Methods, 2020. 17(5): p. 505-508.
- Kim, , et al., Microfabricated monolithic multinozzle emitters for nanoelectrospray mass spectrometry. Anal Chem, 2007. 79(10): p. 3703-7.
- Mao, , R. Gomez-Sjoberg, and D. Wang, Multinozzle emitter array chips for small-volume proteomics. Anal Chem, 2013. 85(2): p. 816-9.
- Mao, , et al., Multinozzle emitter arrays for nanoelectrospray mass spectrometry. Anal Chem, 2011. 83(15): p. 6082-9.
- Chen, , P. Mao, and D. Wang, Quantitation of Intact Proteins in Human Plasma Using Top-Down Parallel Reaction Monitoring-MS. Anal Chem, 2018. 90(18): 10650-10653.
- Campuzano I, K., Nanoproteomics: Methods and Protocols. Toms SA, Weil RJ, editors. Humana Press, 2011(2011): p. 57-70.
- Sobott, R., Carol V., Characterising electrosprayed biomolecules using tandem-MS- the noncovalent GroEL chaperonin assembly. Int. J. Mass Spectrom, 2004. 236(236): p. 25-32.
- Yan, , et al., Versatile, Sensitive, and Robust Native LC-MS Platform for Intact Mass Analysis of Protein Drugs. J Am Soc Mass Spectrom, 2020. 31(10): p. 2171-2179.
- Vimer, , et al., Comparative Structural Analysis of 20S Proteasome Ortholog Protein Complexes by Native Mass Spectrometry. ACS Cent Sci, 2020. 6(4): p. 573-588.
- Olinares, D.B. and B.T. Chait, Native Mass Spectrometry Analysis of Affinity-Captured Endogenous Yeast RNA Exosome Complexes. Methods Mol Biol, 2020. 2062: 357-382.
- Campbell, G., et al., 2.8 A resolution reconstruction of the Thermoplasma acidophilum 20S proteasome using cryo-electron microscopy. Elife, 2015. 4: e06380