Goal
Here we report the integration of Newomics MnESI source and Bruker maXis II UHR-QTOF mass spectrometer for native size-exclusion chromatography-mass spectrometry. A 2-fold sensitivity gain and a LOQ of 11 ng were achieved with the combined platforms for the NISTmAb characterization under native conditions.
Introduction
Since the introduction of biopharmaceutical drugs in the 1980s, it has revolutionized the treatment for a broad range of diseases [1]. Among the different types of biopharmaceutical drugs, monoclonal antibodies (mAb) based therapeutics currently claim over 25% of the global market. The characterization of biopharmaceutical drugs is more challenging due to their structural complexities [2]. Heterogeneities including post-translational modification, aggregation, and degradation could be introduced during the production, purification, formulation, and/or delivery process [3]. For example, the production of antibody-drug conjugates (ADCs) typically leads to a mixture of ADCs with a different drug to antibody ratio (DAR) and conjugation sites.
The distribution of the DAR could affect the stability and efficacy of the ADCs and needs to be tightly controlled.
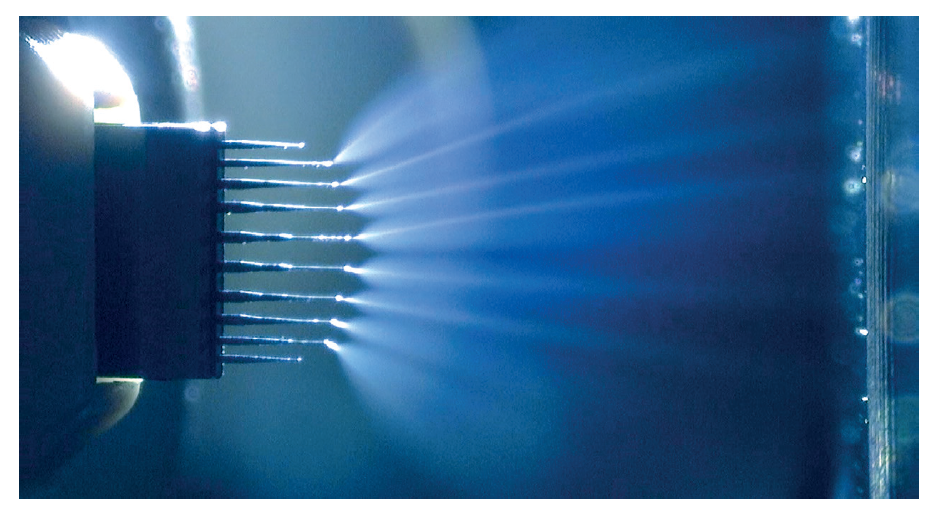
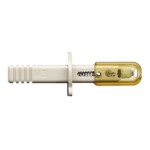
Liquid chromatography coupling with mass spectrometry plays an important role in biopharmaceutical characterization because of its ability to separate, identify and quantify individual compounds from the mixture. For instance, scientists from Seagen demonstrated that native size exclusion chromatography and mass spectrometry can quantitatively determine the DAR on a variety of cysteine-linked ADCs, comparable to hydrophobic interaction chromatography [4]. Recently, a Microflow-nanospray ElectroSpray Ionization (MnESI) platform developed by Newomics was reported to achieve high sensitivity, high throughput, and high quantitation accuracy for intact protein characterization using the M3 multinozzle emitters [5]. The M3 emitter, shown in Figure 1, splits the incoming microflow LC eluent to multiple nanoflow streams, thereby significantly enhancing the ionization efficiency and reducing matrix effects.
Bruker maXis II offers highly resolved intact mass data for mAb-based therapeutics such as ADCs. In addition, soft ion transfer conditions make it suited for intact protein characterization under non-denaturing conditions in a robust platform. This application note focuses on native SEC-MS integrated with Newomics MnESI source and a Bruker maXis II mass spectrometer to achieve high resolution and high sensitivity intact mAb characterization under native conditions.
Experiment
Materials and Instrumentation
The carbonic anhydrase purchased from Sigma-Aldrich (St. Louis, MO) was diluted to 10 µg/mL in 20% acetonitrile (ACN) before analysis. The same buffer was later used as the mobile phase for flow injection. The NISTmAb RM 8761, humanized IgG1k was purchased from NIST (Gaithersburg, MD), consisting of 1 unit containing 800 µL of 67 µM (10 mg/mL) IgG1k in 12.5 mmol/L histidines, 12.5 mmol/L histidine HCl (pH 6.0). Aliquoted antibody stored at -80°C was thawed at room temperature and diluted in 200 mM NH4OAc solution with 10% isopropanol (pH 6.8) before analysis. The LC-MS grade water, isopropanol, and ammonium acetate (NH4OAc, Cat. # 431311-50G) were purchased from Sigma-Aldrich (St. Louis, MO).
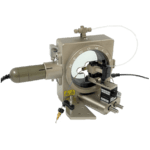
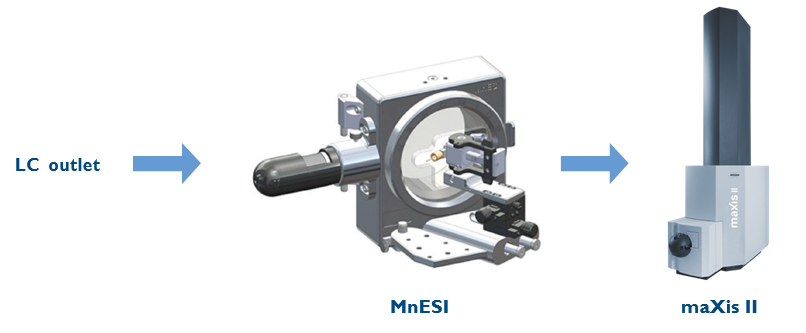
An Ultimate 3000 RSLCnano system (Thermo Fisher Scientific, Bremen, Germany) was used for the flow injection of carbonic anhydrase at 10 µL/min. Two types of ion sources were compared: a Bruker ESI sprayer (ESI, Apollo II) and a micro-flow-nanospray electrospray ionization source (MnESI), Model#: IS-B01, and multinozzle M3 emitters (8 nozzles, 10 µm ID) provided by Newomics (Berkeley, California). Figure 2 demonstrates the setup of the LC-MnESI-MS platform. The LC outlet was connected to the M3 emitter through a 50 µm ID nanoViper tubing. The emitter position was adjusted on the x-axis and y-axis with the translation stage. A built-in light source and USB camera were installed on the MnESI source to view the live image of the emitter and spray. The distance between the emitter and the capillary was measured and optimized with the microscope image to be 3.5 mm.
The capillary flow size-exclusion chromatography was performed on the same UHPLC system with a PolyLC PolyHYDROXYETHYL A™ Capillary column (150 x 0.3 mm; 3 µm; 300 Å) at 2 µL/min and room temperature. The mobile phase was 200 mM NH4OAc solution with 10% isopropanol at isocratic elution. Native mass spectrum of the protein was acquired with a maXis II UHR-QTOF instrument (Bruker Daltonics, Biller- ica, MA). The following acquisition parameters were adopted (Source voltage – 4500 V, Nebulizer gas – 0.4 Bar, Dry gas – 3 L/min, Dry temperature – 250°C, isCID – 180 eV). The ions were introduced to the mass spectrometer through the Newomics MnESI ion source. The dry temperature should not exceed 250°C to prevent salt precipitation and clogging the emitters. After the experiments were done, the emitter was flushed with water and methanol. The LC flow was turned off and the stage was pulled out afterward to improve the lifetime of the emitter.
Data Processing
The data was processed with Data Analysis and BioPharma Compass® 2021 for data visualization and automated deconvolution. Maximum entropy deconvolution was performed with 5300-6300 m/z input range, 140000 to 160000 Mr range for the NIST mAb.
Result and discussion
Comparison of different ion sources for flow injection of carbonic anhydrase
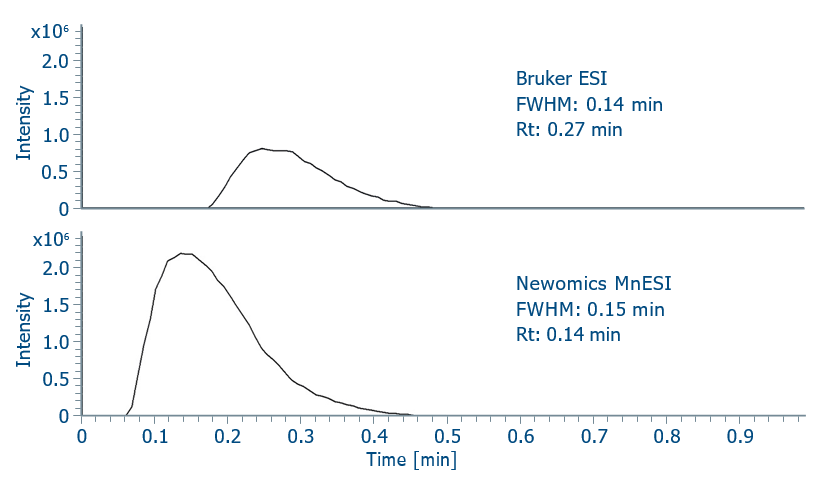
Carbonic anhydrase was used as a model protein to study the sensitivity gains of the Newomics MnESI sprayer over other conventional ion sources. The acquisition parameters were optimized for each analysis with 5 ng injection mass. Compared with the Bruker ESI sprayer, the Newomics MnESI sprayer reduced the dead volume inside the ion source as the retention time of carbonic anhydrase shifted from 0.27 min to 0.14 min. More importantly, the Newomics MnESI sprayer improved the peak intensity by two-fold relative to the standard ESI source as shown in Figure 3.
MnESI platform for LC-MS analysis for native NISTmAb
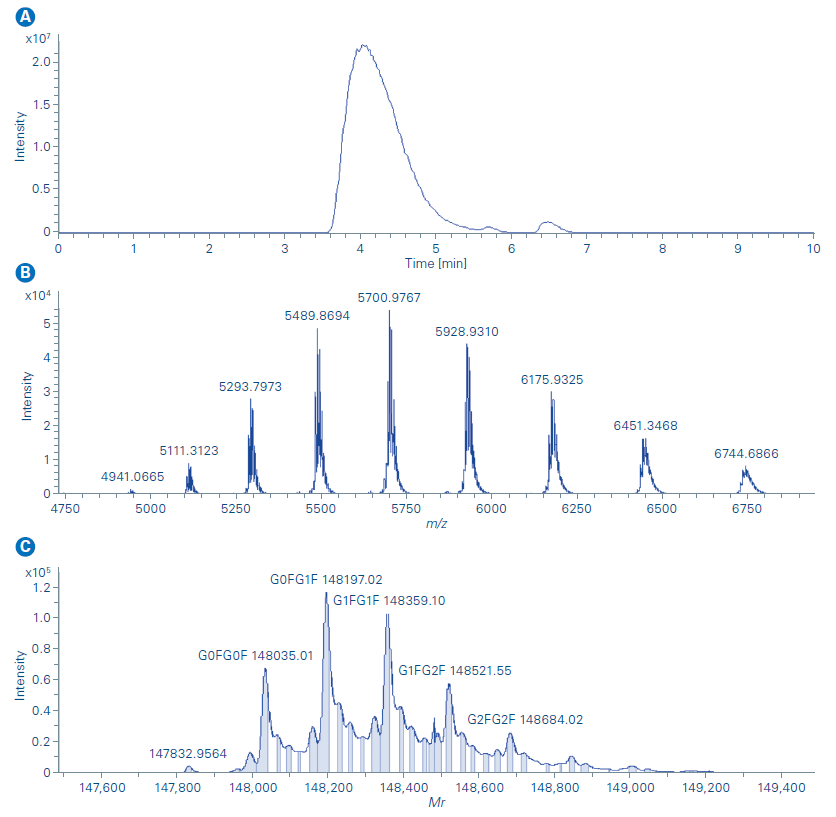
The Newomics MnESI platform was then applied for intact NIST- mAb characterization under native conditions. Capillary flow size exclusion chromatography was used to remove the formulation buffer from the original sample and elute the protein in ammonium acetate. Isopropanol was added to the mobile phase to improve protein recovery and ionization efficiency. No post-column flow splitting strategy was needed for the flow rate used. Nebulizer gas flow, dry gas flow, dry temperature, isCID, and other MS acquisition parameters were optimized for the native NISTmAb characterization. As illustrated by the extracted ion chromatogram (m/z 5000 – 6500) in Figure 4a, the NISTmAb was eluted at 4.1 min. The mass spectra in Figure 4b shows that a native charge distribution envelope was observed with the corresponding most abundant charge state of 26+ suggesting the native conformation of NISTmAb was well preserved with the Newomics MnESI. Maintaining the native molecular interactions from the solution phase into the gas phase is important for studying non-covalent complexes such as ADCs (antibody-drug conjugates) for drug-to-antibody ratio (DAR) and protein-ligand interactions. The deconvoluted mass spectrum of NISTmAb shows all major glycoforms of NISTmAb were identified and this further demonstrated enhanced desolvation and adduct removal can be achieved with the Newomics MnESI source as shown in Figure 4c.
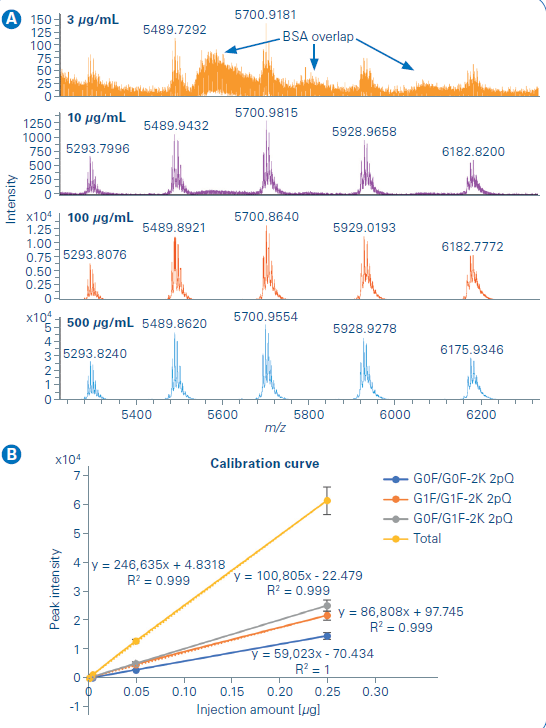
The limit of detection and quantification was then studied for the Newomics MnESI platform on the maXis II. A serial dilution of NISTmAb, from 3 µg/mL to 500 µg/mL, was prepared for the analysis with 10 µg/mL BSA added to the sample solution to reduce the sample loss caused by non-specific binding to the glass vial. The BSA was partially resolved from the NISTmAb peak in the LC chromatogram while the overlap between the charge envelope of BSA and NISTmAb occurred as shown in Figure 5a. Therefore, the deconvoluted mass spectrum processed with BioPharma Compass was used for quantification over the extracted ion chromatogram method. A linear response (Figure 5b) of more than 2 orders of magnitude was observed from NISTmAb quantification with the three most abundant glycoforms used for the analysis. 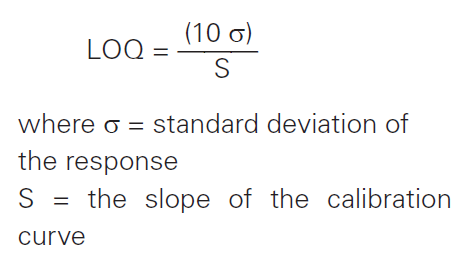
The limit of quantification is expressed as the following equation was determined from the calibration curve to be 11 ng. Triplicate measurements were performed for each sample concentration. The relative standard deviations were within 10% for higher concentration (≥ 100 µg/mL) and within 25% for lower concentration (≤ 10 µg/mL).
Conclusion
- A two-fold sensitivity gain was achieved for carbonic anhydrase by coupling the Newomics MnESI ion source with the maXis II UHR-QTOF
- The same LC-MnESI-maXis II set was used for intact antibody characterization with a LOQ of 11 ng under native
- The high resolution of Bruker maXis II and improved sensitivity of Newomics MnESI source serves as a sensitive and robust platform for intact protein biotransformation
References
- Kesik-Brodacka M (2018). Progress in biopharmaceutical development. Biotechnology and applied biochemistry, 65(3), 306-322.
- Chung J (2017). Special issue on therapeutic antibodies and biopharmaceuticals. Experimental & molecular medicine, 49(3), e304-e304.
- Jefferis R (2018). Protein heterogeneity and the immunogenicity of biotherapeutics. GaBI J, 7(2), 63-69.
- Jones J, Pack L, Hunter JH, Valliere-Douglass JF (2020, January). Native size-exclusion chromatography-mass spectrometry: suitability for antibody-drug conjugate drug-to-antibody ratio quantitation across a range of chemotypes and drug-loading levels. In MAbs (Vol. 12, 1, p. 1682895). Taylor & Francis.
- Yan Y, Xing T, Wang S, Li N. (2020). Versatile, Sensitive, and Robust Native LC-MS Platform for Intact Mass Analysis of Protein Drugs. Journal of the American Society for Mass Spectrometry, 31(10), 2171-2179.