Goal
To demonstrate significant sensitivity improvement and rugged performance for analyzing small molecules (with pesticides as an example in this note), using the Newomics microflow-nanospray ESI-MS (MnESI-MS) platform.
Introduction
The sensitivity of liquid chromatography coupled to mass spectrometry (LC-MS) increases significantly with a decreasing column diameter and reduced flow rates. The relationship has been shown to follow a power-law function empirically [1]. As a result, microflow LC-MS has benefits with increased sensitivity, reduced sample, and solvent consumption, and decreased matrix effects, compared to conventional high-flow LC-MS. However, it still lacks sensitivity compared to nanoflow electrospray because of its lower ionization efficiency at the microflow. Newomics unique multinozzle emitters divide the microflow LC eluent into eight nanoflow electrospray nozzles. The 10 micron ID electrospray nozzles achieve nanoflow desolvation efficiency. As a result, the theoretical spray current increases proportionally to the square root of the number of nozzles [2]. Here, using pesticides in the fruit matrix as a case study, we performed a three-way comparison between MnESI-MS with M3 emitters, high-flow LC-MS with HESI (heated ESI) needles, and microflow LC-MS with stainless steel nanospray tips (SStip). We have demonstrated the sensitivity gain and robust and reproducible performance of our MnESI-MS platform.
Methods
1. Sample Preparation
Organic grapefruit sample was extracted with acetonitrile (ACN) using a QuEChERS method, which is a sample preparation procedure to extract pesticides from food. The grapefruit extract was diluted twice with water and filtered through a 0.2 µm syringe filter. After centrifugation at 10,000 x g for 5 min, the supernatant was taken out and mixed with 241 pesticide standards. The final ACN concentration in the sample was about 35%. For calibration experiments, ten concentrations of pesticide standards were spiked in grapefruit matrix at the concentration of 0, 0.001, 0.003, 0.01, 0.03, 0.1, 0.3, 1, 3, and 10 ppb, respectively, and in triplicates. For robustness experiments, 300 injections of 1 ppb pesticide standards spiked in grapefruit matrix (1 µL injection volume) were performed.
2. Instrumentation
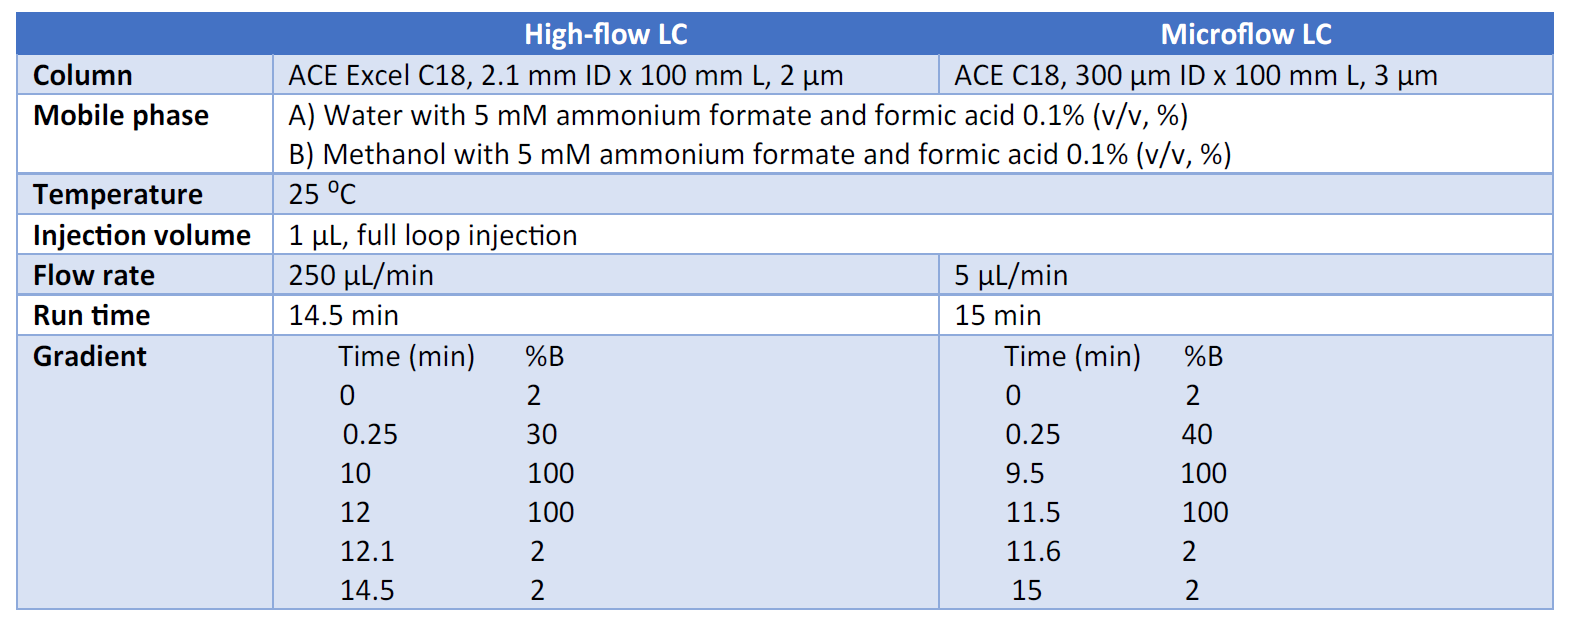
The chromatographic separation was performed on UltiMate 3000 RSLCnano UHPLC system (Thermo Fisher Scientific) with the following conditions.
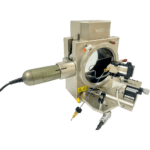
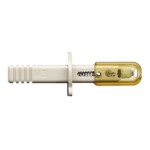
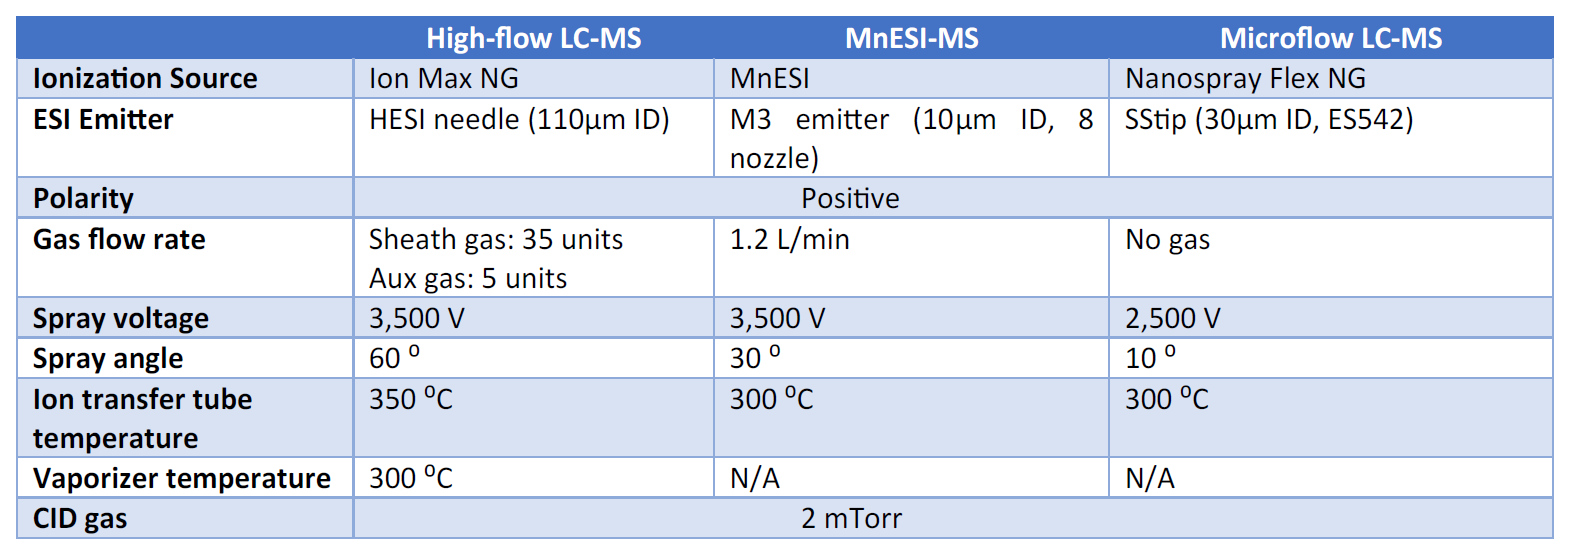
The scheduled, selected reaction monitoring (SRM) analysis of pesticides was performed on a TSQ Quantiva Triple Quadru- pole Mass Spectrometer with a Thermo Scientific Ion Max NG source, a Thermo Scientific Nanospray Flex NG ion source, or a Newomics MnESI platform.
3. Data Analysis
Tracefinder™ software (Thermo Fisher Scientific) was employed to automatically process raw data after acquisition.
Results and Discussion
1. MnESI-MS platform significantly improves sensitivity for pesticide analysis
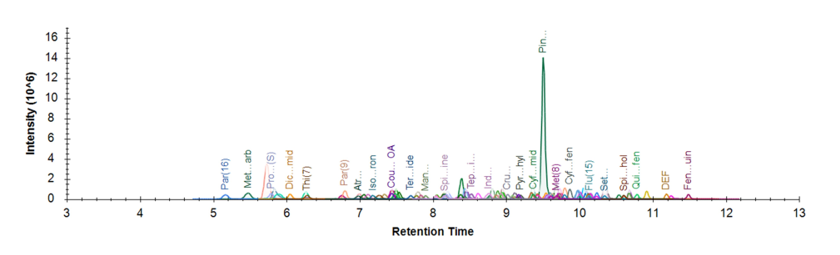
We first developed and optimized the scheduled LC-SRM/MS assay to quantify the 241 pesticides. Figure 1 shows a representative extracted ion chromatogram of grapefruit extract spiked with 1 ppb of 241 pesticide standards, using MnESI-MS platform with M3 emitters at a flow rate of 5 µL/min. With nearly the same chromatographic run time (15 min) as high-flow LC (14.5 min), excellent separation and detection of the pesticide compounds were achieved at microflow rates. We then performed a three-way comparison between MnESI-MS, conventional microflow LC-MS, and high-flow LC-MS. We determined the sensitivity gain for all 241 pesticide compounds by injecting an equal amount of sample and comparing the signal enhancement between the three different platforms.
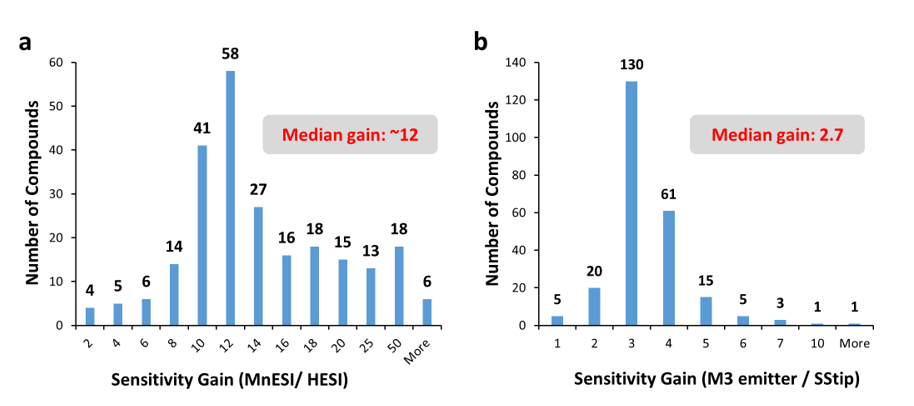
The results are summarized in Figure 2. The enhancement from MnESI-MS with the M3 emitter over high-flow LC-MS with HESI ranged from 2 to 150-folds with the median gain of ~12-fold (Figure 2a). In addition, using the same column and identical conditions, MnESI-MS achieved the median sensitivity gain of ~2.7 over conventional microflow LC-MS with a nanospray emitter (SStip).
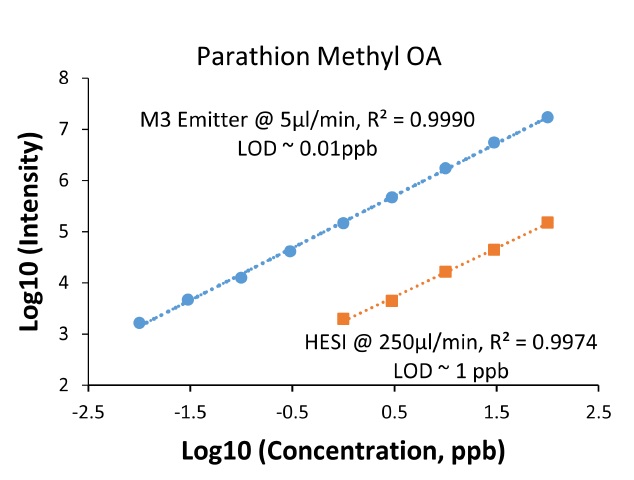
We also performed calibration experiments for all pesticide compounds and quantified their limit of detection (LOD) individually. As shown in Figure 3 for a representative compound (parathion methyl OA), excellent linearity was obtained and the LOD was determined to be 0.01 ppb by MnESI-MS in comparison to 1 ppb from high-flow LC-MS with HESI. The LOD values are consistent with the sensitivity improvement of ~110-fold between M3 emitter and HESI for this pesticide.
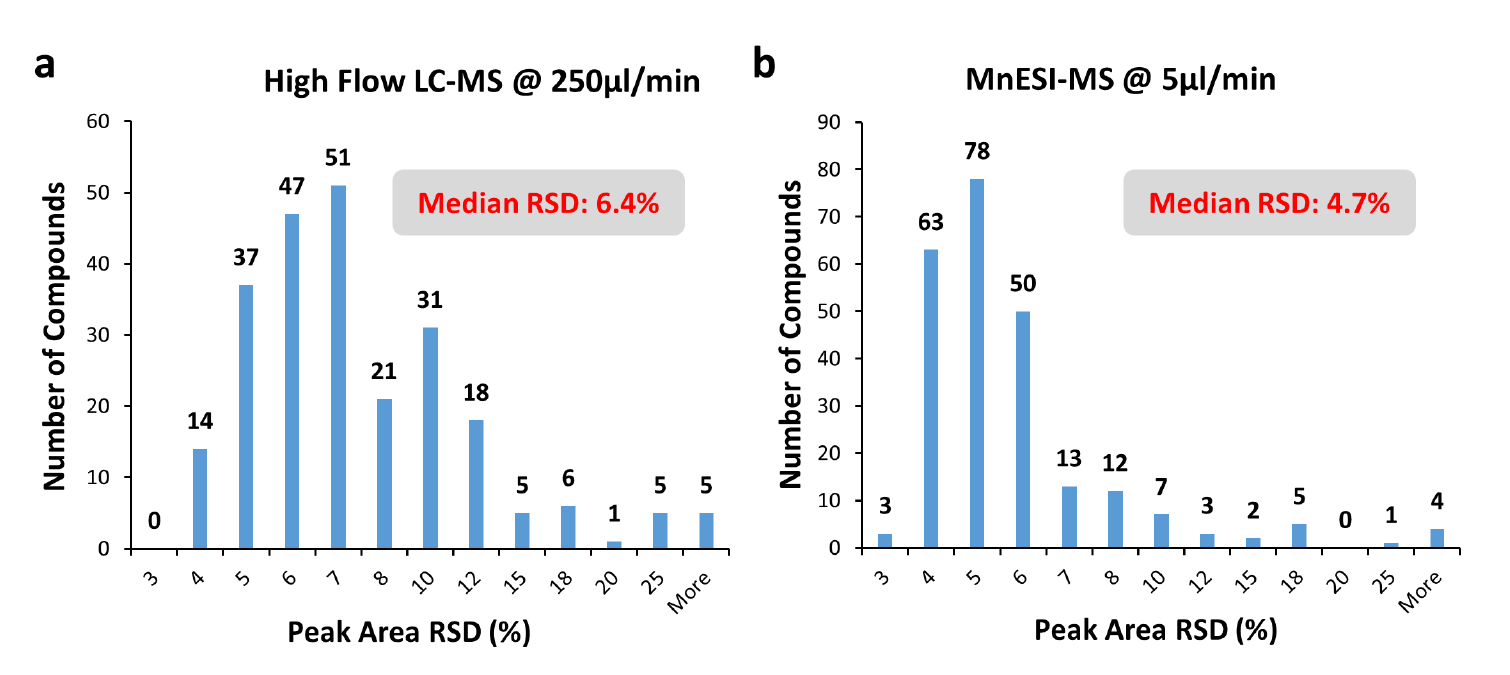
2. MnESI-MS platform delivers excellent reproducibility and robustness
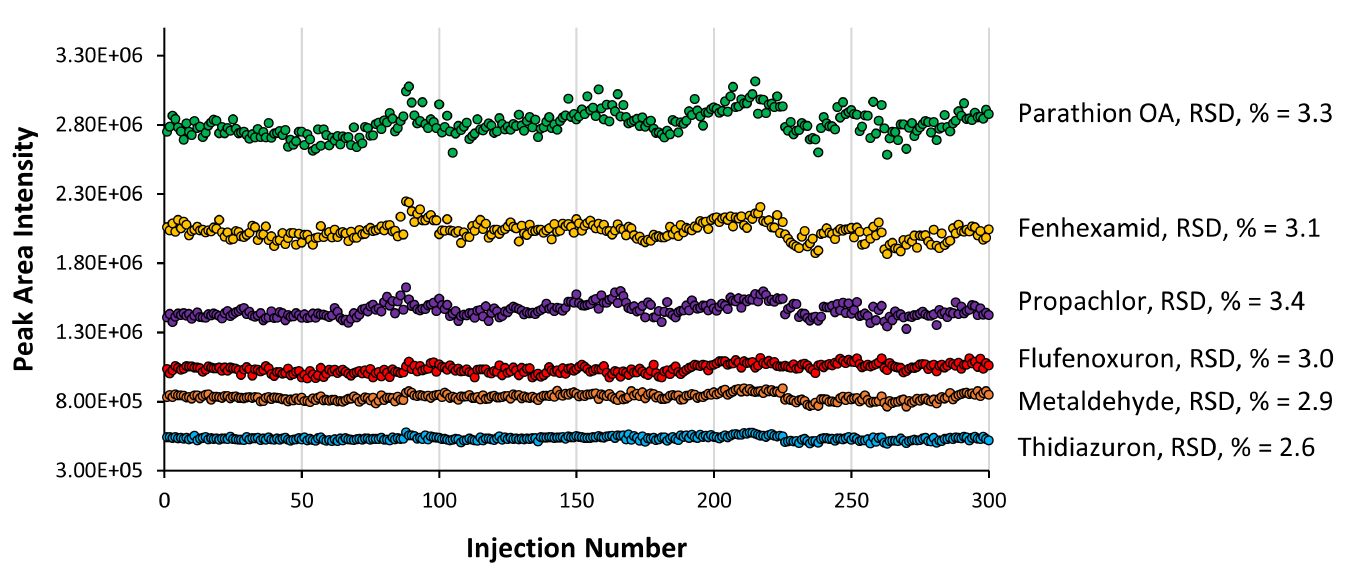
To assess the robustness and reproducibility of the MnESI-MS platform, we performed over 300 injections of grapefruit extracts spiked with 241 pesticides. Figure 4 shows the peak area reproducibility with relative standard deviation (RSD) for six representative compounds. The RSD is less than 3.5 % for all of them. For all 241 compounds (Figure 5), we achieved the median RSD of 4.7% using the MnESI-MS platform in comparison to 6.4% using the high-flow LC-MS. The slightly better RSDs from MnESI-MS might be due to their much stronger MS signals than high flow HESI because of the over 10-fold sensitivity gain. In addition, we didn’t observe any clogging or decreased performance after 300 injections on our M3 emitters. These results demonstrated the rugged performance and excellent reproducibility over time for MnESI-MS with our M3 emitters.
Conclusion
In summary, we have demonstrated a MnESI-MS platform with M3 emitters as a unique solution that integrates micro-flow LC with nanospray MS, with the benefit of significantly enhanced mass spectrometry sensitivity over conventional high-flow needles and nanospray emitters. In addition, we have achieved the same level of reproducibility and rugged performance as high flow LC-MS, for LC-MS analysis of small molecules such as pesticides.
Reference
[1] Thermo Fisher Scientific, TN72277-EN 0717S
[2] P. Mao, H-T. Wang, P. Yang, and D. Wang, Multinozzle Emitter Arrays for Nanoelectrospray Mass Spectrometry, Anal. 83, 6082 (2011)
[3] Anastassiades, S.J. Lehotay, D. Stajnbaher and F.J. Schenck, Journal of AOAC International, 86(2), 412-431 (2003)